7 Best OpenAI Cost Monitoring Tools for 2026
14 min read
Tools

Table of Contents
Comparing the top OpenAI cost monitoring tools are 1. Amnic, 2. OpenAI Usage and Cost Dashboard, 3. Datadog, 4. Helicone, 5. Elastic Observability, 6. New Relic, and 7. Vantage.
An OpenAI cost monitoring tool watches your API spend as it happens. It reads token usage per call, attributes the cost to a model, key, team or feature, and warns you when a number moves before the monthly invoice confirms it.
OpenAI bills on usage, and a single shipped prompt change or a retry loop can move daily spend by a wide margin. Finance and platform teams treat real-time spend tracking as core FinOps hygiene, not an afterthought.
OpenAI exposes a Usage API and a Costs API for exactly this reason. They return your activity and spend data so your dashboards can poll it directly (OpenAI docs).
Amnic monitors OpenAI spend the way a finance team needs it. Token cost is tracked per call and mapped back to the team, feature or customer that drove it, with budgets and anomaly detection that fire before the invoice lands.
It sits on top of a full FinOps platform, so the view that shows GPT-4o usage also shows AWS, Azure and GCP cost. You get one number for infrastructure plus AI spend, not a separate LLM dashboard nobody in finance opens.
This page is about watching the meter, not cutting the bill. If your job is to reduce the OpenAI invoice through caching, model routing and batching, that is a separate discipline with its own toolset.
The tools below are graded on how well they track, attribute and alert. Strong cost attribution is the line that separates a real monitor from a usage chart you read by hand.
Top 7 OpenAI Cost Monitoring Tools
Amnic: FinOps platform that tracks OpenAI token spend per call, attributes it to teams and features, and alerts before the invoice with built-in anomaly detection.
OpenAI Usage and Cost Dashboard: the native baseline, with a live cost chart, per-model breakdowns and the Usage and Costs APIs for your own dashboards.
Datadog: APM-grade LLM observability that adds token count and estimated cost to every OpenAI request span, with real invoices in Cloud Cost Management.
Helicone: open-source LLM observability that logs every request and its cost through a one-line base-URL swap.
Elastic Observability: prebuilt OpenAI dashboards built on the Usage API for SRE teams already running the Elastic Stack.
New Relic: AI monitoring inside a full APM platform, tracking token usage and estimated cost next to application performance.
Vantage: cloud FinOps tool that pulls OpenAI billing directly and sets budgets and anomaly alerts alongside cloud spend.
What are OpenAI cost monitoring tools?
OpenAI cost monitoring tools are platforms that continuously track how much you spend on the OpenAI API and show that spend in close to real time, broken down by model, API key, project, team or feature.
They work by reading two kinds of data, which together form the backbone of disciplined AI token management. The first is usage and billing data straight from OpenAI, through the Usage and Costs API, which returns token counts and dollar figures for your organization.
The second is request-level telemetry captured at the application. Each call to GPT-4o or an o-series model carries its input tokens, output tokens, latency and the metadata that says which customer or feature triggered it. A monitor joins the two streams so the dollar figure on the invoice traces back to the code path that caused it.
For a finance or platform lead, the value is control without waiting. You get an alert when a key burns faster than its baseline, you hold each team to its per-model budgeting limits, and you see a spike the hour it begins.
That distance between an engineering usage log and a finance-ready number is what these tools close. The strongest ones keep OpenAI spend next to the rest of the cloud estate, so AI never becomes a blind spot.
These tools fall into three groups. OpenAI's native dashboard and Spend Controls cover the basics. AI observability and gateway tools such as Helicone, Langfuse, Portkey and LiteLLM capture per-request cost at the application. Enterprise FinOps platforms such as Amnic, Vantage and Finout allocate OpenAI spend across teams and set it next to cloud cost.
Which group fits depends on whether you need engineering traces or finance-ready attribution. Monitoring answers what you spend and when, while cutting that spend is the job of OpenAI cost optimization tools, a separate companion category.
Comparison Table: OpenAI Cost Monitoring Application
Information reflects vendor sources as of June 2026. Confirm current pricing with the vendor.
Tool | Best for | What it monitors (OpenAI signals) | Real-time alerts and anomaly detection | Free option | Pricing |
|---|---|---|---|---|---|
Amnic | Finance and FinOps teams owning AI plus cloud spend | Tokens per call, model, team, feature, customer, plus AWS/Azure/GCP in one view | Yes, budgets and anomaly detection that alert before the invoice | Demo and trial | Roughly 0.25% to 1% of monitored spend |
OpenAI Usage and Cost Dashboard | The starting baseline every account already has | Cost chart, per-model usage, Usage and Costs API export | Budget alerts only, no anomaly detection | Included with account | Free (you pay only API usage) |
Datadog | Engineering teams already standardized on Datadog APM | Token count and estimated cost per request span, plus real invoices | Yes, monitors and anomaly detection on metrics | 14-day trial | Usage based, LLM spans plus per-host APM |
Helicone | Developers wanting fast request-level cost logging | Per-request cost, tokens, model, cache hits | Alerts on paid tiers | Yes, 10,000 requests per month | Free tier, Pro from $20 per seat per month |
Elastic Observability | SRE teams running the Elastic Stack | Token usage, model, invocation counts, latency via Usage API | Yes, through Elastic alerting rules | 14-day trial | Standard from about $95 per month, tiered |
New Relic | Teams wanting AI cost inside full-stack APM | Token usage, estimated cost, requests, model names | Yes, custom alerts on tokens and cost | Yes, 100 GB per month | Usage based on data ingest and users |
Vantage | Cloud FinOps teams adding LLM spend | OpenAI billing pulled directly, budgets, allocation | Yes, anomaly alerts on cost deviation | Yes, limited tier | Fixed subscription, confirm with vendor |
How We Evaluated OpenAI Cost Monitoring Tools
Real-time visibility: how fresh the spend data is, from per-request streaming to a daily billing refresh, and how fast a spike shows up.
Attribution depth: whether the tool can split OpenAI cost by model, key, project, team, feature and customer, not just show one org-level total.
Alerting and anomaly detection: whether budgets, thresholds and automated spike detection fire before the invoice rather than after.
Coverage breadth: whether OpenAI sits next to other LLM providers and the cloud bill, or stands alone in a separate dashboard.
Setup and operating cost: the effort to instrument calls and the risk that the monitoring tool itself becomes an expensive line item.
Buyer fit: whether the output is finance-grade for chargeback and showback, or engineering telemetry for debugging.
Top OpenAI Cost Monitoring Tools in 2026
1. Amnic
Best for: finance, FinOps and platform teams that own OpenAI spend alongside the rest of the cloud bill and need attribution they can charge back.
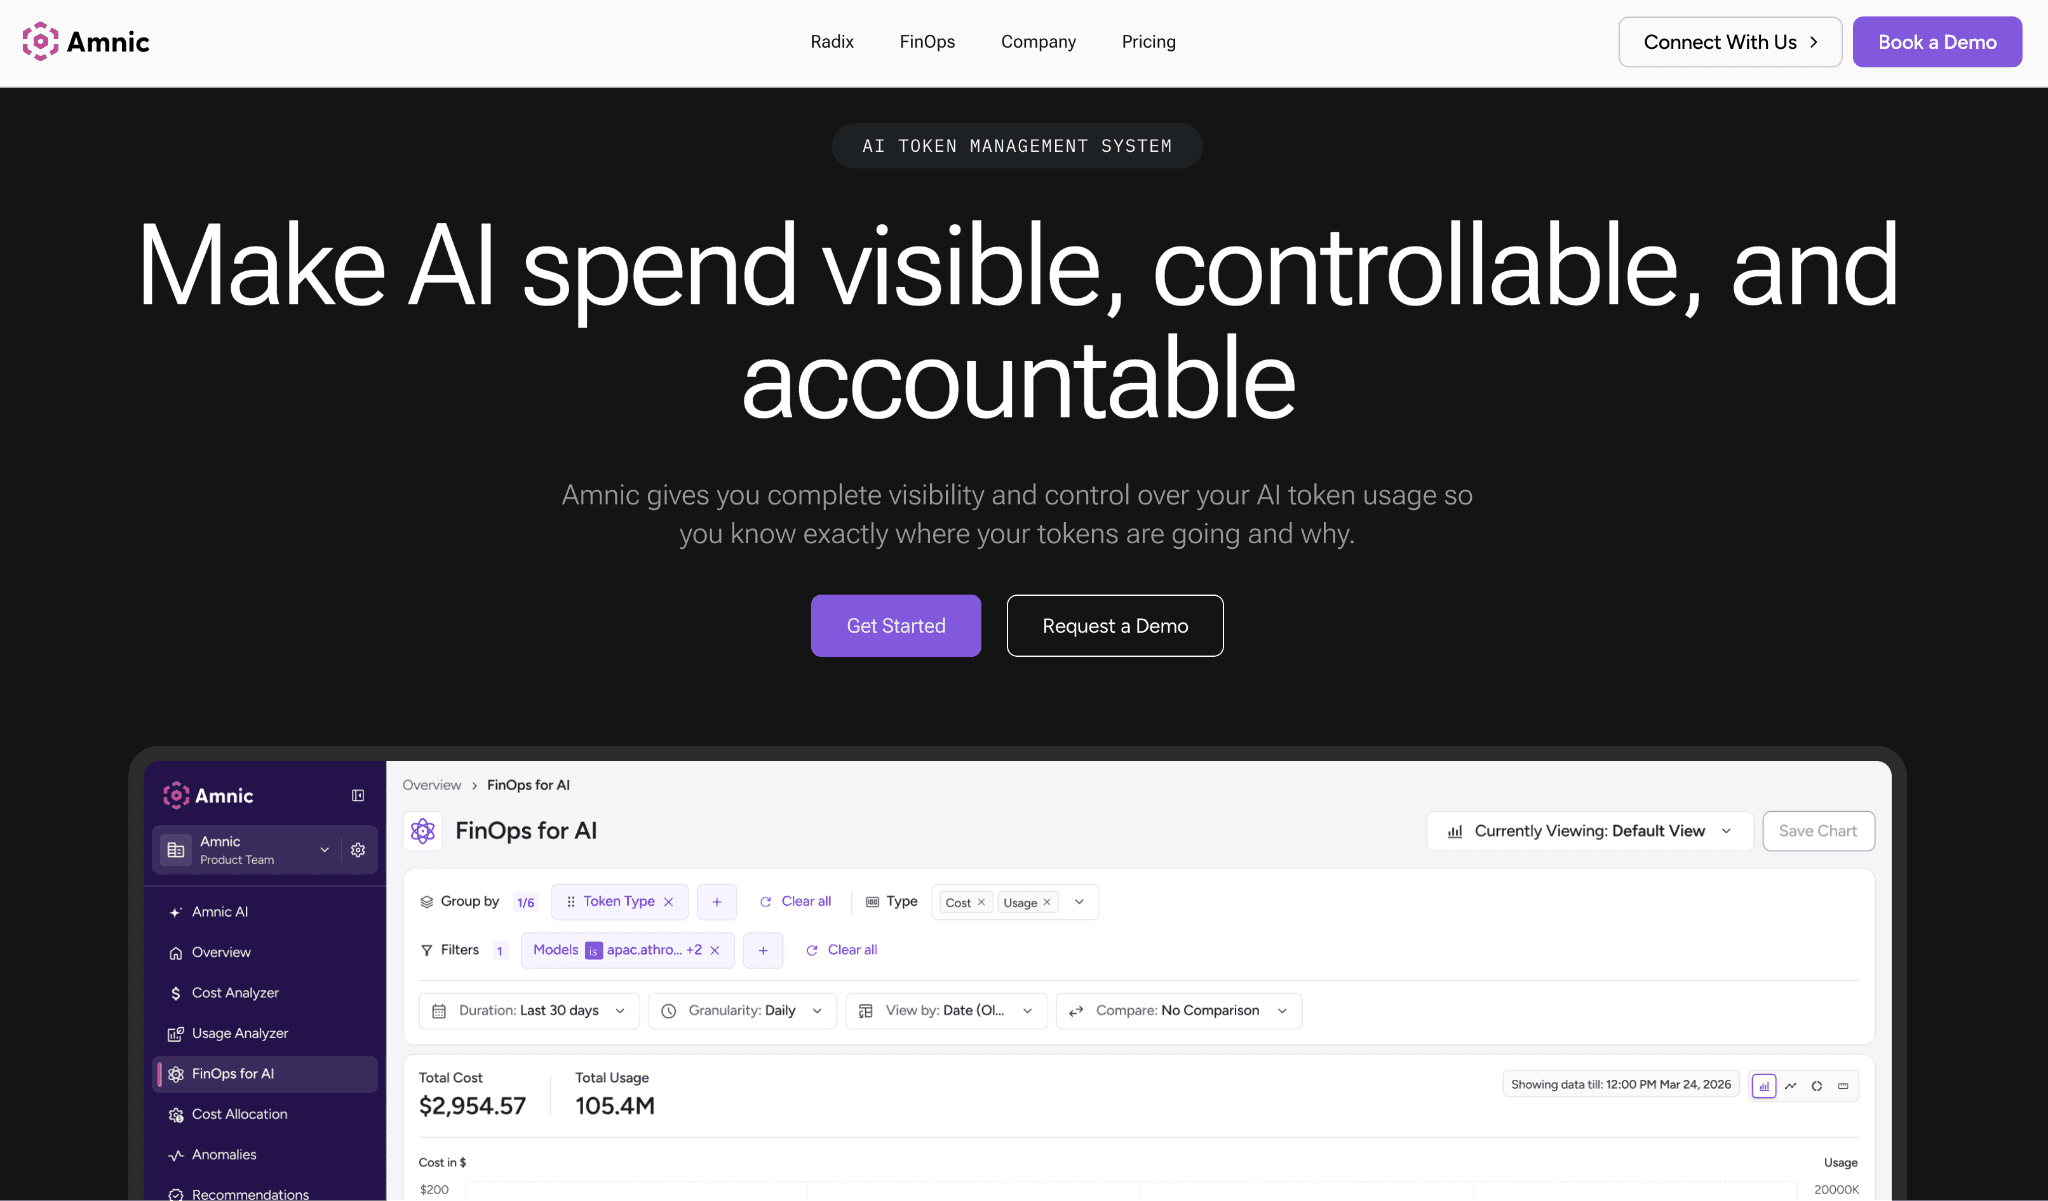
Amnic monitors OpenAI cost the way a finance team reads it. It tracks input and output tokens on every call across OpenAI, Anthropic, Gemini and Bedrock, the providers weighed in our Anthropic vs OpenAI cost guide, then maps that spend back to the team, feature or customer that caused it.
Instead of one organization total, you get a per-feature and per-customer breakdown. That answers margin questions, and the cost-and-margin-per-feature view lets a product lead see whether a GPT-4o feature pays for itself.
The monitoring acts before the bill arrives. Budgets per team and per model alert and trip before the invoice lands, and the monitoring view flags cost spikes the moment they start.
Amnic reads data agentless and read-only, connecting to your OpenAI and cloud billing without write access, and it carries SOC 2, ISO and GDPR certification. Because OpenAI spend sits next to AWS, Azure and GCP cost, with Claude tracked the same way teams use Anthropic cost visibility tools, AI becomes one line in the same FinOps picture.
Key features:
Per-call token tracking across OpenAI, Anthropic, Gemini and Bedrock, so multi-model spend lands in one view instead of four consoles.
Attribution that maps spend to team, feature and customer, which is what turns a usage chart into a chargeback you can defend.
Anomaly detection that flags spikes the moment they start, before the monthly invoice confirms the damage.
Budgets per team and per model that alert and trip, giving finance a guardrail rather than a postmortem.
Cost and margin per feature, so product owners can see which AI features actually pay for themselves.
OpenAI spend shown next to AWS, Azure and GCP, removing the blind spot where AI hides outside cloud cost reports.
AI agents that allocate spend automatically and generate reports for finance and engineering, so attribution is not a manual monthly export.
Agentless, read-only connection with SOC 2, ISO and GDPR coverage, so security review clears it quickly.
Pricing: Amnic charges a percentage of the spend it monitors, roughly 0.25% to 1%, so the cost scales with the bill it protects rather than a flat platform fee. A demo and trial are available before you connect production billing.
Pros:
Finance-grade attribution down to feature and customer, not just an org-level total.
One view for AI and cloud spend, so OpenAI is never a separate report nobody reconciles.
Alerts and anomaly detection fire before the invoice, which is the whole point of monitoring.
Cons:
The depth suits teams running a real FinOps practice more than a solo developer watching one API key.
Percentage-of-spend pricing means very large bills pay more than a flat tool, though the attribution usually pays it back.
2. OpenAI Usage and Cost Dashboard
Best for: any team that wants a starting baseline, since every OpenAI account already has it at no extra cost.
The native dashboard is the honest first stop. The Usage page shows a live cost chart, date filters and per-model breakdowns priced against the published OpenAI API pricing, so you can spot a daily spike and see total charges in the current cycle.
You can export a CSV with date, model, tokens and cost, then load it into a spreadsheet or BI tool for deeper analysis (OpenAI Help Center).
Beyond the chart, OpenAI gives you Spend Controls: a monthly budget threshold and project-level budget alerts that email you when spend crosses a set amount. The catch matters for monitoring. OpenAI no longer enforces a hard cap that blocks requests, so the alert notifies you but does not stop the spend.
For anything programmatic, the Usage API and Costs API return your organization's activity and spend, which is what every third-party tool here reads under the hood. The view reports at organization and project level, so splitting cost by customer or feature means building that logic yourself, and there is no anomaly detection to catch a spike you did not predict.
Key features:
Live cost chart in the current billing cycle, so today's spend is visible without any setup.
Per-model usage breakdown that shows whether GPT-4o or an o-series model drives the bill.
Date filters to compare spend across days and isolate the day a change shipped.
CSV export with date, model, tokens and cost for spreadsheet or BI analysis.
Usage API for programmatic activity data, the same source third-party tools poll.
Costs API that returns dollar figures so you can build a custom spend view.
Spend Controls with a monthly budget threshold and project-level budget alerts by email.
Project-level grouping to separate a few workloads inside one organization.
Pricing: the dashboard and APIs are included free with any OpenAI account, so you pay only for the API usage itself. There is no upgrade tier for the monitoring view.
Pros:
Free and already present, with no integration work to see basic spend.
Reads the authoritative billing source directly, with no estimation gap.
Cons:
Budget alerts only notify, since OpenAI dropped the enforced hard cap, so nothing stops a runaway key on its own.
Attribution stops at project level, so per-team, per-feature and per-customer breakdowns need custom work.
3. Datadog
Best for: engineering organizations already standardized on Datadog that want OpenAI cost inside the same APM they already run.
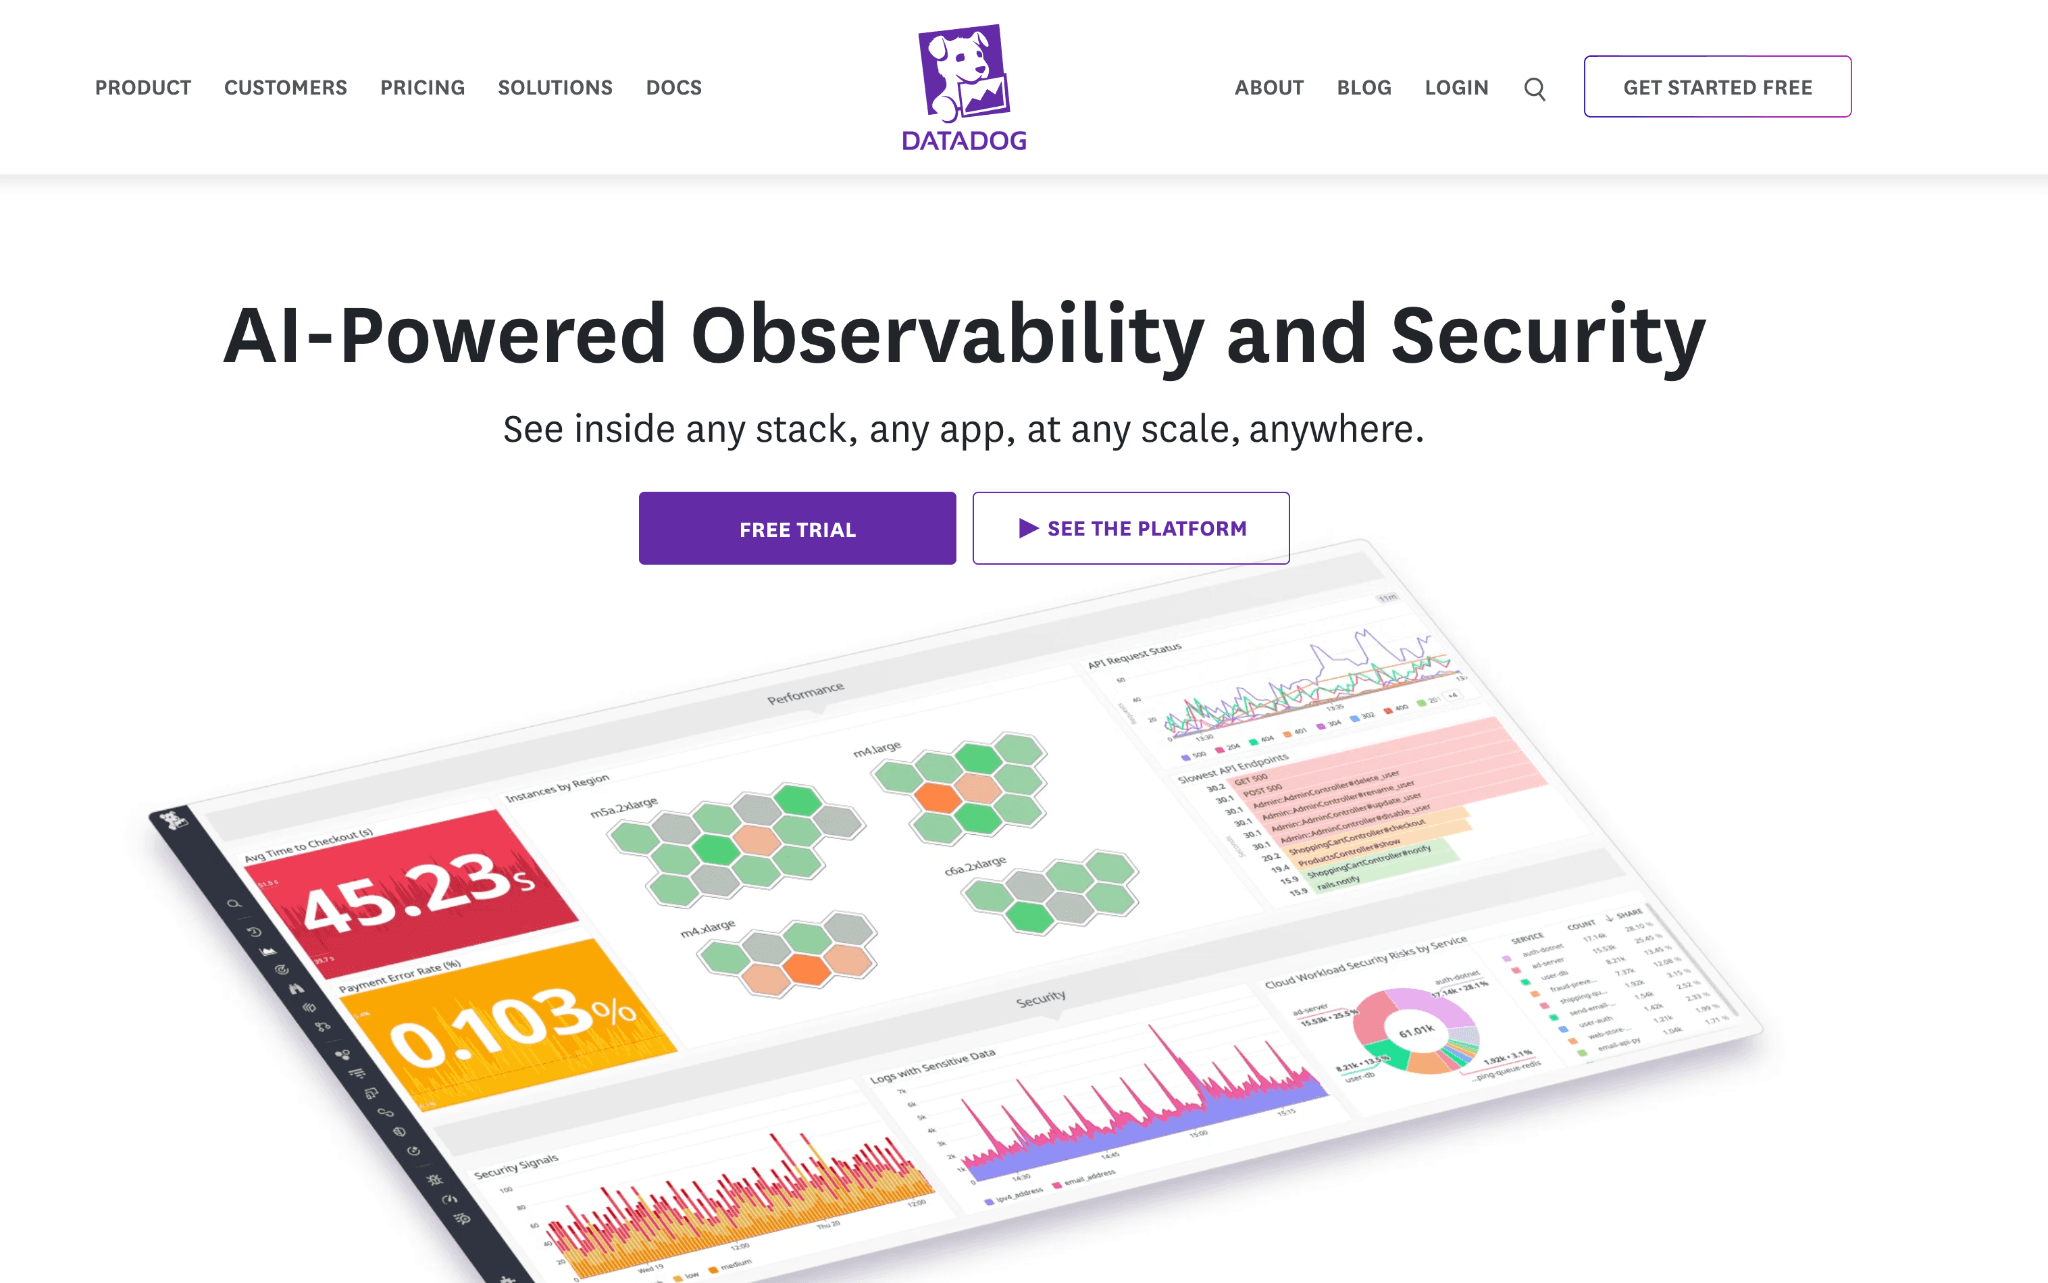
Datadog folds OpenAI spend into its observability platform through LLM Observability. It auto-instruments calls to OpenAI, Anthropic, Bedrock and LangChain, adding a token count and an estimated cost to every request span.
That lets you break down the impact of each OpenAI call inside a trace and find the calls behind a costly request. Datadog estimates cost for more than 800 models, which keeps a multi-provider stack in one place.
The cost story gets stronger with Cloud Cost Management, which pulls the real OpenAI invoice alongside Datadog's per-request estimates. You get both the billed total and the request-level detail in one view.
The trade-off is price and complexity. LLM Observability bills on span volume on top of per-host APM, and Datadog can auto-activate the premium LLM feature when it detects LLM spans, so a high-traffic workload drives the bill up sharply. Attribution is engineering-shaped too, built around services and traces rather than finance-ready cost centers.
Key features:
Auto-instrumentation for OpenAI, Anthropic, Bedrock and LangChain, so calls are captured without manual tagging.
Token count and estimated cost attached to every request span for per-call drill-down.
Estimated cost across 800-plus models, keeping a mixed-provider stack in one dashboard.
Cloud Cost Management pulls real OpenAI invoices next to the per-request estimates.
Trace-level view that isolates the exact calls behind a costly request.
Monitors and anomaly detection on metrics, so a token or cost spike can page someone.
Tight fit with existing Datadog APM, logs and infrastructure data already in place.
Pricing: Datadog is usage based, with LLM Observability billed on span volume layered on per-host APM pricing and custom-metric overages. A 14-day trial is available, and costs can climb quickly at high request volume.
Pros:
Per-request cost detail inside full traces, which is excellent for debugging expensive calls.
Real invoice plus estimate together when Cloud Cost Management is added.
Cons:
Pricing compounds across per-host APM, LLM spans and overages, so a busy OpenAI workload can make the monitor itself expensive.
Attribution is service and trace centric, so finance-grade chargeback by customer or feature takes extra modeling.
4. Helicone
Best for: Developers who want fast, request-level cost logging with almost no integration effort.
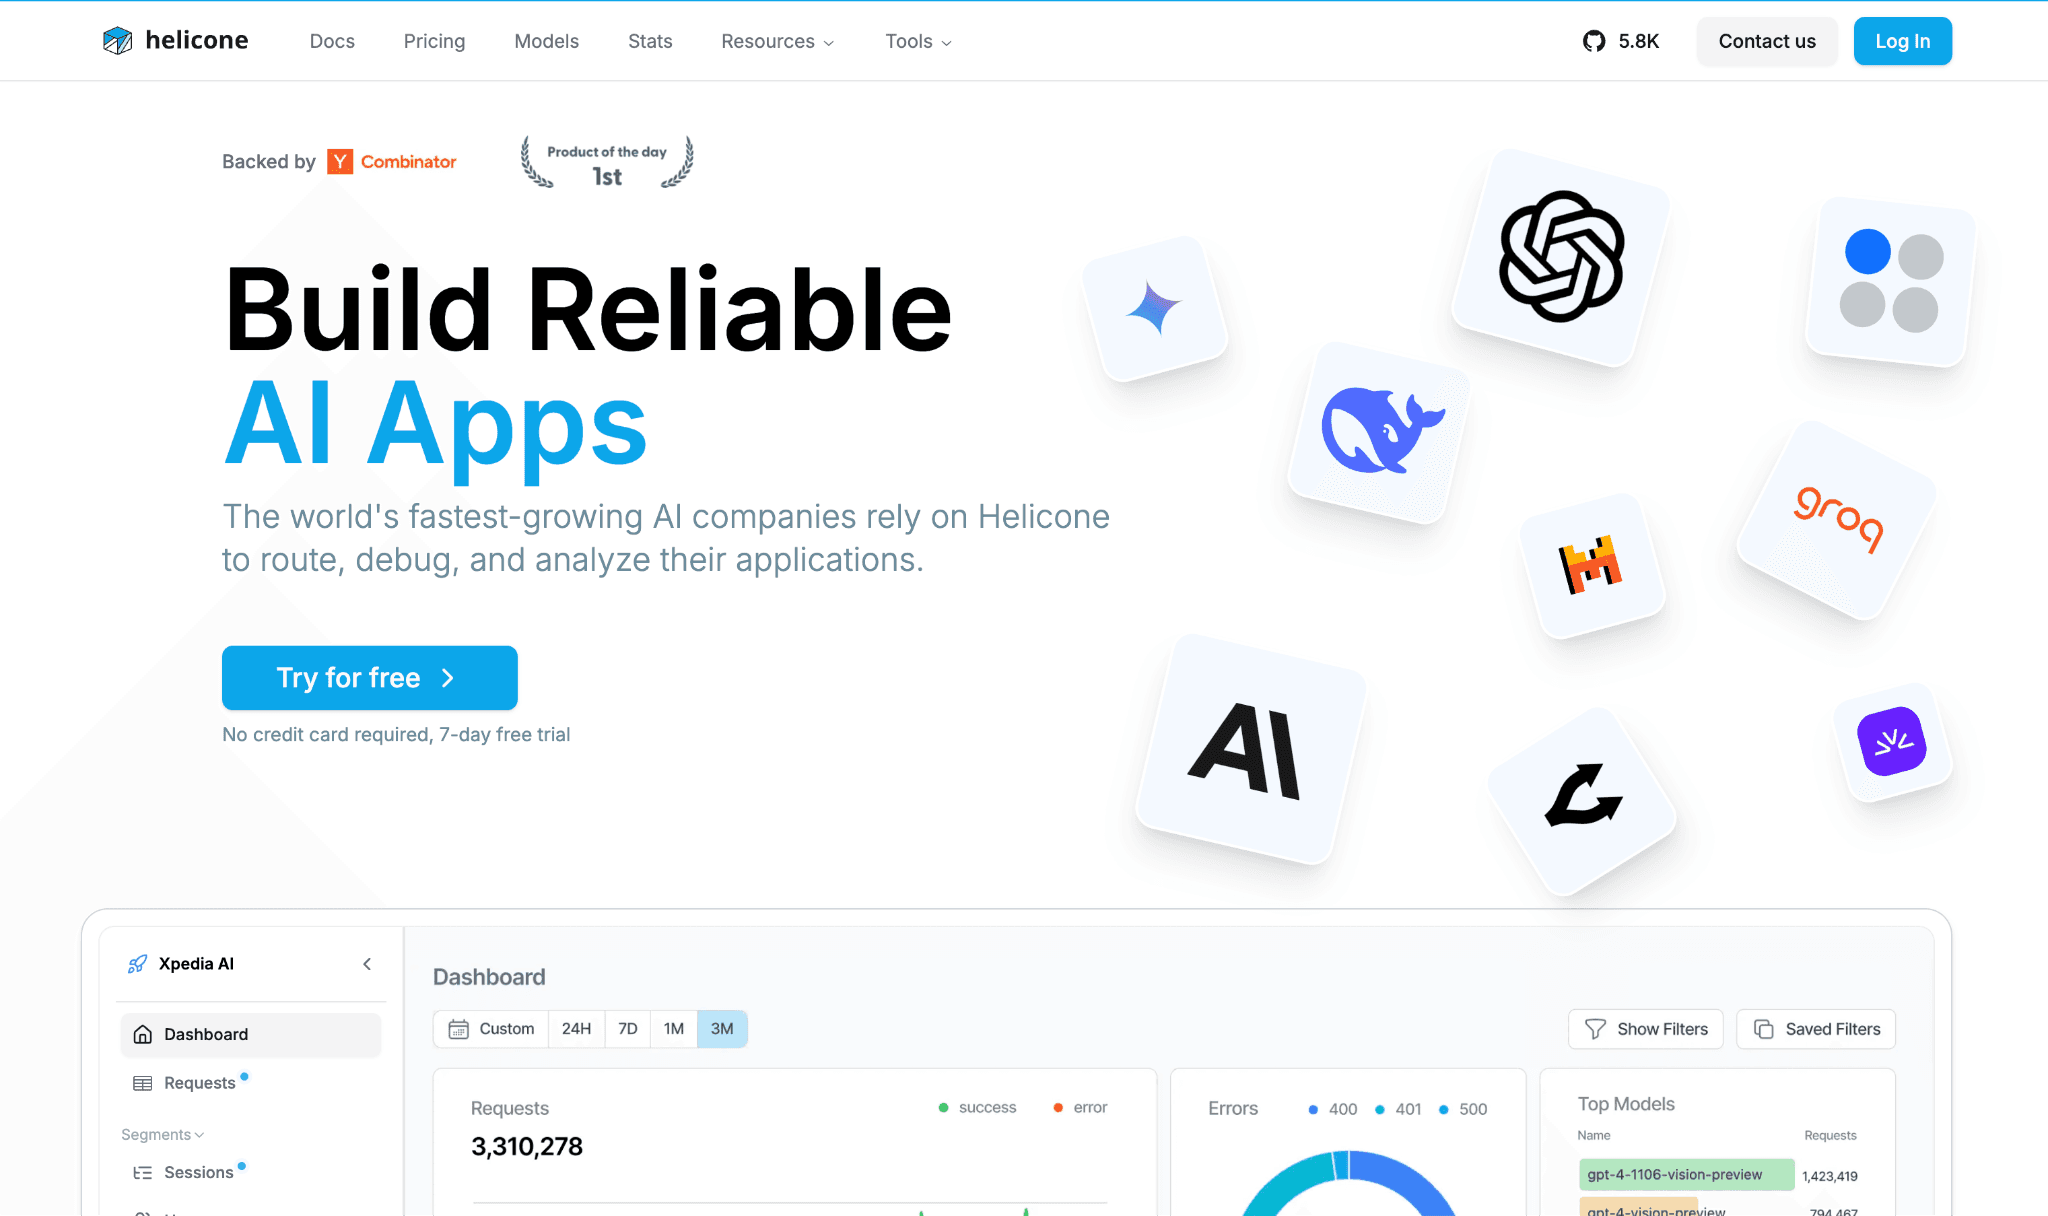
Helicone is an open-source LLM observability platform, YC W23, built around a one-line change. You swap your OpenAI base URL to route through Helicone and immediately get logging, dashboards and cost tracking.
Every request is captured with its tokens, model, latency and cost, across more than 300 models. For a developer who wants to answer what an endpoint cost today, it is one of the quickest tools to stand up.
The architecture is the thing to weigh. Routing requests through a proxy adds a network hop that latency-sensitive teams must plan for, though Helicone also offers an async logging path.
The free tier covers 10,000 requests a month with no card, and paid plans start at $20 per seat per month plus volume pricing. It is a strong engineering tool, but the output is request logging rather than finance-ready chargeback, so mapping spend to cost centers still needs a layer on top.
Key features:
One-line base-URL swap to start logging OpenAI calls without an SDK rewrite.
Per-request capture of tokens, model, latency and cost across 300-plus models.
Dashboards that rank prompts and models by spend so the expensive paths surface fast.
Caching that can cut repeat-request cost, useful for high-overlap traffic.
Custom properties to tag requests by user or feature for rough segmentation.
Open-source core, so a team can self-host and keep request data in its own environment.
Alerting on paid tiers when usage or error rates move.
Pricing: the free tier covers 10,000 requests per month with no card, and Pro starts at $20 per seat per month plus volume-based pricing. The hosted gateway adds a platform fee on pay-as-you-go usage.
Pros:
Fastest path to per-request OpenAI cost visibility, often live the same day.
Open-source and self-hostable, which keeps sensitive request data in-house.
Cons:
The proxy hop adds latency and a dependency that strict production paths must design around.
Output is engineering logging, so finance-grade attribution and chargeback need an added layer.
5. Elastic Observability
Best for: SRE and platform teams already running the Elastic Stack who want OpenAI usage in the same place as their logs and metrics.
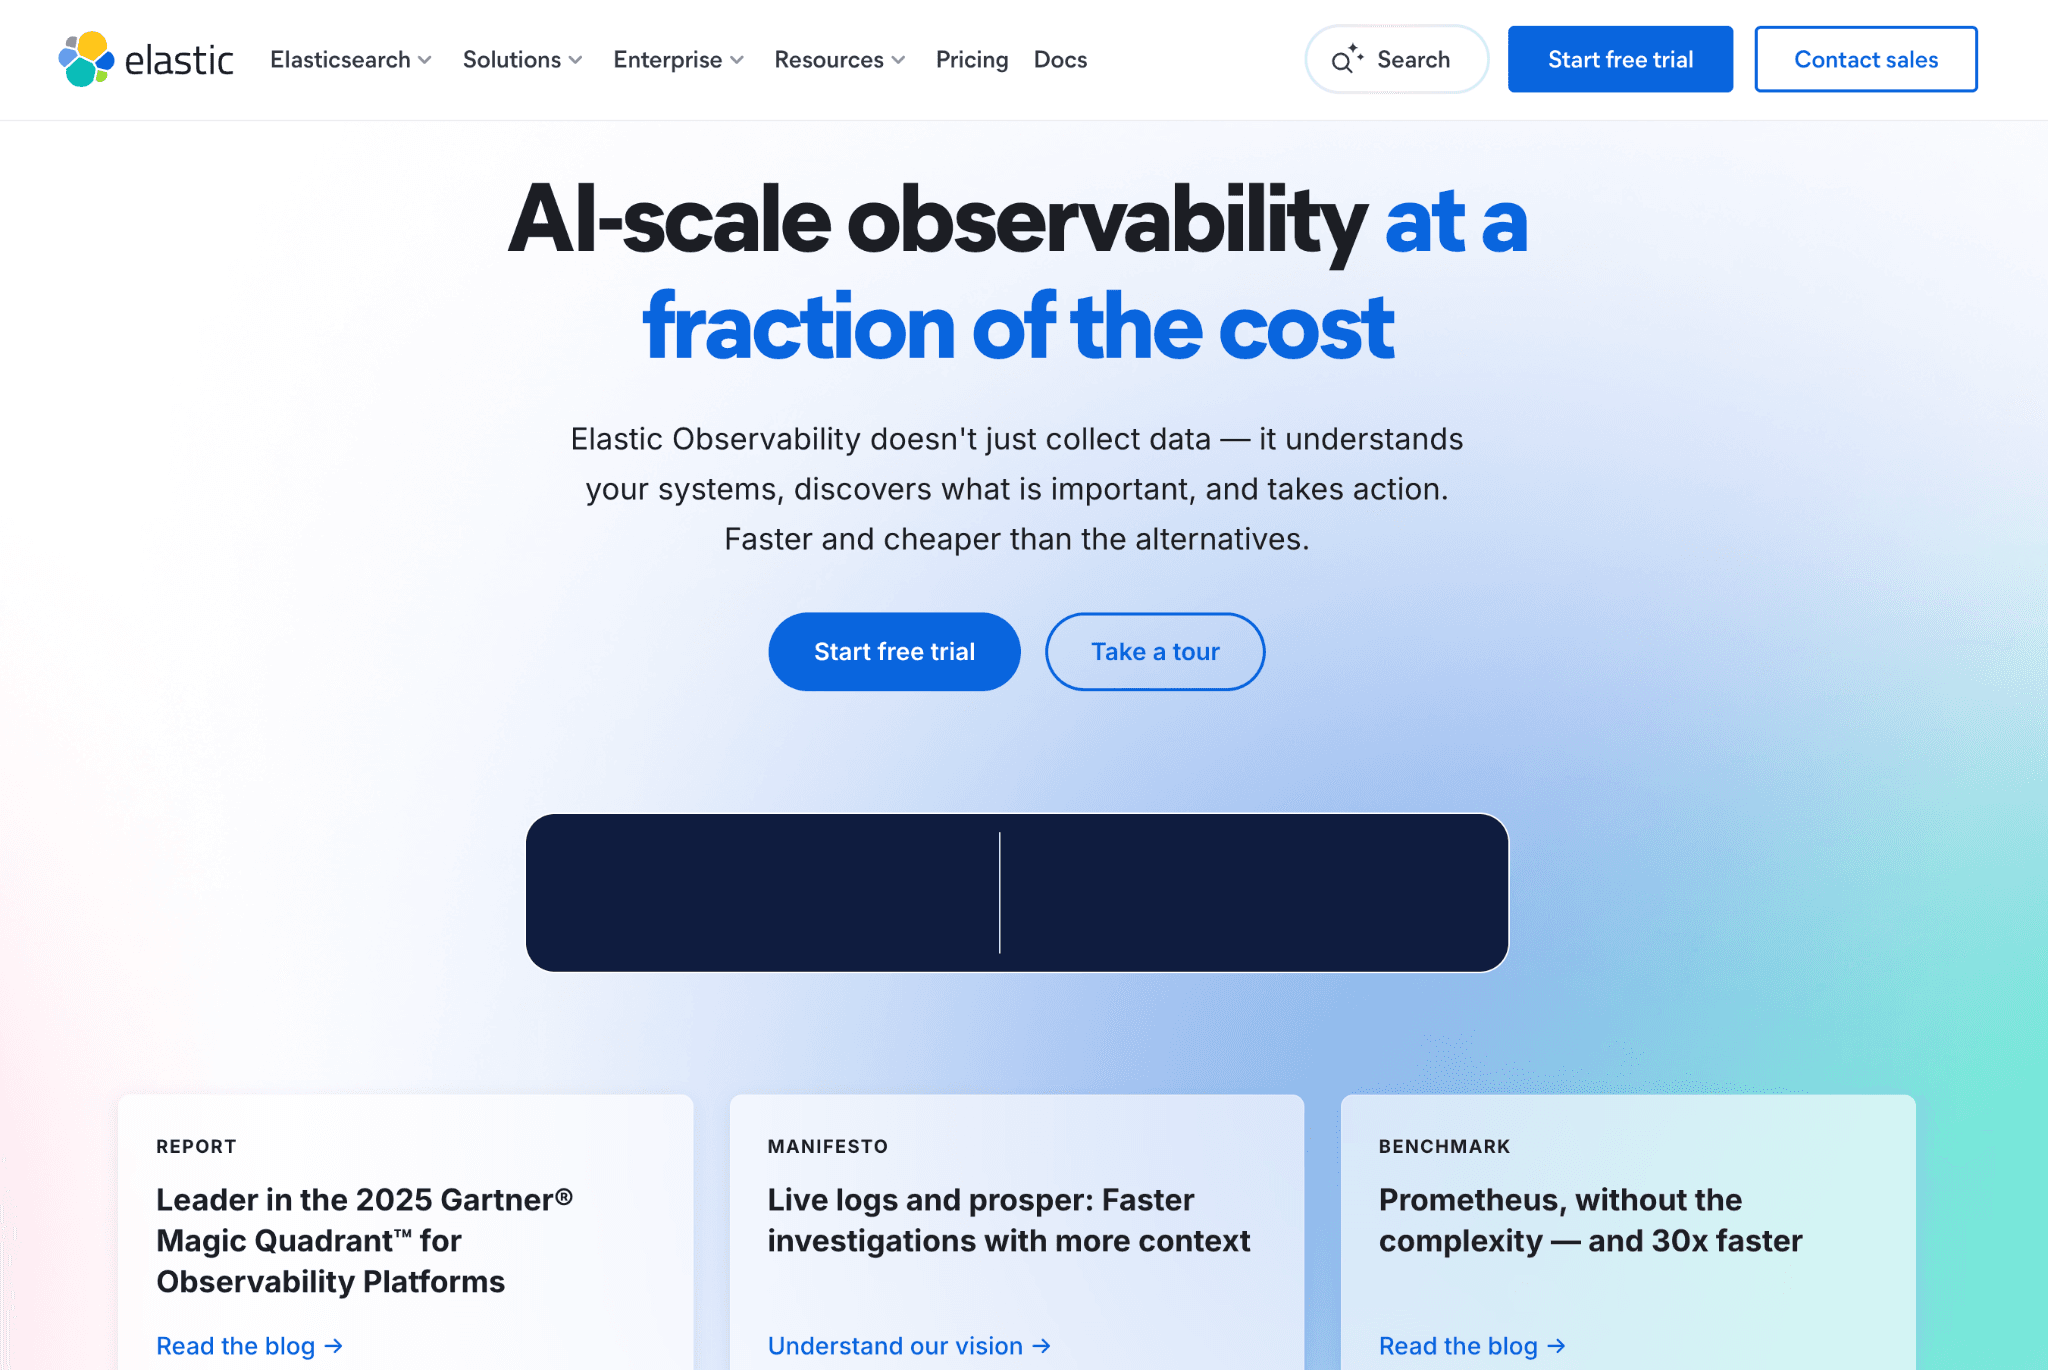
Elastic ships an OpenAI integration that uses the OpenAI Usage API to pull consumption and identify which models are in use. It comes with prebuilt dashboards for invocation counts, error rates, latency, utilization and token usage, including models like GPT-4o and DALL-E, so an SRE spots a bottleneck and a cost driver in the same console they already watch.
The fit is best when Elastic is already your observability backbone. The integration treats OpenAI as one more data source feeding existing dashboards and alerting rules, efficient if the stack is in place and heavier if it is not.
Elastic offers Hosted, Serverless and Self-managed deployments with resource-based, usage-based and license-based billing, so operating cost depends on how much data you ingest and retain. The strength is technical monitoring, and turning that into finance chargeback by team is extra work rather than a built-in report.
Key features:
OpenAI integration built on the Usage API, so consumption data comes from the billing source.
Prebuilt dashboards for token usage, invocation counts, error rates, latency and utilization.
Model identification, including GPT-4o and DALL-E, to see which models carry the load.
Elastic alerting rules to trigger on usage or cost thresholds you define.
One pane that puts OpenAI telemetry next to existing application logs and metrics.
Three deployment models, so you can run it hosted, serverless or fully self-managed.
Strong search and retention for historical usage analysis over long windows.
Pricing: Elastic Observability is subscription based with Standard from roughly $95 per month, Platinum near $125 and Enterprise around $175, and the hosted tier adds resource-based charges. A 14-day trial is available.
Pros:
Excellent fit if Elastic is already the observability stack, with little new tooling to learn.
Long retention and powerful search make historical usage analysis straightforward.
Cons:
Resource-based pricing on the hosted tier can grow unpredictably as ingest scales.
Designed for SRE monitoring, so finance-grade cost allocation is not an out-of-the-box report.
6. New Relic
Best for: teams that want OpenAI cost and usage sitting inside a full-stack APM view next to application performance.

New Relic markets its AI monitoring as the first APM for AI, bringing OpenAI spend into the same platform as application and infrastructure data. Agents instrument OpenAI, Bedrock and LangChain across Python, Node.js, Ruby, Go and .NET.
With about two lines of code you get cost, response time, token usage, request counts and model names on a dashboard. The pitch is one view across the app, the infrastructure and the AI layer, so a slow and expensive feature is diagnosed in one place.
For monitoring, you can set custom alerts on tokens used and compare models for cost, performance and quality side by side. That helps a team see which model is the expensive one before deciding what to do about it.
Pricing is usage based on data ingest plus billable users, with a perpetual free tier of 100 GB a month. The cost figures are estimates derived from token usage rather than the OpenAI invoice, and finance attribution is lighter than the engineering view.
Key features:
Agents for OpenAI, Bedrock and LangChain across five major languages, so most stacks are covered.
Roughly two-line setup to capture cost, tokens, response time and model names.
Full-stack view that ties AI cost to application and infrastructure performance.
Custom alerts on token usage and cost so a spike pages the on-call team.
Side-by-side model comparison for cost, performance and quality in one screen.
Sample inputs and outputs alongside metrics for debugging expensive prompts.
Perpetual free tier that lets small workloads monitor at no cost.
Pricing: New Relic uses usage-based pricing on data ingest plus billable users, with a perpetual free tier of 100 GB per month. Larger stacks should model ingest volume before committing.
Pros:
AI cost lives next to application performance, so root cause and cost are diagnosed together.
The free 100 GB tier makes it genuinely usable for small workloads at no cost.
Cons:
Data-ingest and per-user pricing can surprise at scale if AI telemetry is verbose.
Cost figures are token-based estimates, not the OpenAI invoice, and chargeback is limited.
7. Vantage
Best for: cloud FinOps teams that already track AWS, Azure and GCP and want to add OpenAI spend to the same console.
Vantage approaches OpenAI as one more billing source in a broad cloud cost tool. It connects directly to the OpenAI billing API alongside 20-plus cloud providers, then lets you monitor token consumption, set budgets, detect anomalies and allocate OpenAI cost next to the rest of the bill.
Because it reads the billing API directly, it catches direct API spend that cloud-native integrations miss when teams call OpenAI outside a cloud account.
For monitoring, Vantage projects OpenAI spend using historical data and machine learning, and alerts when usage or cost deviates from the normal pattern. The main limit is freshness: it refreshes daily rather than streaming per request, so it suits trend monitoring and allocation more than catching a runaway loop within the hour.
Trace-level prompt detail is also shallower than the dedicated observability tools, since the product is cloud-FinOps first and LLM second.
Key features:
Direct OpenAI billing API connection, so direct API spend is captured outside any cloud account.
Coverage across 20-plus cloud and SaaS providers, putting OpenAI next to AWS, Azure and GCP.
Budgets and custom guardrails that alert when usage or cost exceeds expectations.
Anomaly alerts when OpenAI cost deviates from the historical pattern.
ML-based spend projection to forecast where the OpenAI bill is heading.
Cost allocation that splits OpenAI spend across teams alongside cloud cost.
A reporting layer that finance can read next to the broader cloud bill.
Pricing: Vantage prices on a fixed subscription rather than a percentage of spend, with a limited free tier for smaller workloads. Confirm current tiers with the vendor.
Pros:
Reads OpenAI billing directly, so direct API spend is not lost the way cloud-only tools lose it.
Puts OpenAI in the same FinOps console as the cloud bill for one allocation story.
Cons:
Daily refresh means it is not true real-time, so an in-progress spike shows up later than a per-request monitor.
LLM trace depth is shallower than dedicated observability tools, since it is cloud-FinOps first.
How to Choose the Right OpenAI Cost Monitoring Tool
Match the tool to the problem you actually have, not to the longest feature list.
You need finance-grade attribution and chargeback: choose Amnic. Per-feature and per-customer breakdowns with budgets that alert before the invoice are what finance can act on, and the same view covers cloud spend. Pair it with cloud cost anomaly detection tools thinking so spikes never reach the bill.
You want a free starting point today: use the native OpenAI Usage and Cost Dashboard, and graduate when you need alerting or per-customer attribution it cannot give you.
You are deep in Datadog, Elastic or New Relic already: add their OpenAI integration so AI cost lives next to the telemetry your engineers already watch.
You are a developer wanting per-request cost fast: Helicone is live the same day through a base-URL swap.
You run more than OpenAI: the same monitoring split applies per provider, like Gemini cost optimization tools for teams on Google models.
You cannot add a proxy hop to production: pick a read-only, API-based monitor such as Amnic or the native dashboard over a gateway that routes live traffic, since a proxy adds latency and a failure point.
You run cloud FinOps and want OpenAI in the same console: Vantage adds direct billing and allocation, as long as a daily refresh is fresh enough for the spikes you care about.
You run a formal practice: treat OpenAI as one workload inside your broader FinOps program rather than a standalone dashboard.
You self-host inference on GPUs: monitoring shifts from tokens to hardware, so the cost moves into the territory of GPU cost optimization tools.
Common Mistakes When Choosing an OpenAI Cost Monitoring Tool
Confusing a usage chart with monitoring: A per-model usage graph tells you what happened. Monitoring tells you the moment it starts going wrong. If the tool has no budgets, thresholds or anomaly detection, someone has to watch the screen for it to work, and nobody watches the screen at 2 a.m. Insist on alerting that fires before the invoice, which is what separates real-time LLM observability from a static monthly report.
Stopping at the org-level total: OpenAI's native view reports at organization and project level, which is fine until finance asks which customer or feature drove the spike. If you cannot split spend by team, feature and customer, you cannot do chargeback or answer the margin question. Attribution depth is the feature that separates real tools from a chart you read by hand.
Letting the monitor become the expensive line item: Span-based and ingest-based observability pricing, which you should weigh the same way you compare model rates in an LLM cost comparison, can climb faster than the OpenAI bill it watches. Model the monitoring cost at your real request volume before you commit.
Treating OpenAI as a separate silo: AI spend that lives in its own dashboard, disconnected from AWS, Azure and GCP cost, becomes the line nobody reconciles. Keeping it next to the rest of the bill, with the same cost observability metrics applied, is the principle behind any broad GenAI cost management platform.
Why Decision Makers Choose Amnic for OpenAI Cost Monitoring
Three things stand out for teams that have to answer for the bill, not just read it.
Attribution that finance can use: Amnic tracks tokens per call and maps each dollar back to the team, feature or customer behind it, then shows cost and margin per feature. That turns OpenAI spend from one organization total into a chargeback you can defend, and it powers the unit economics view product owners ask for.
Alerts before the invoice, not after: Budgets per team and per model trip and alert as spend moves, and anomaly detection flags a spike the moment it starts. The point of monitoring is to catch the runaway key while it is still cheap to fix, and Amnic is built around that timing as the alerting backbone of a broader FinOps for AI program.
One view for AI and cloud: OpenAI spend sits next to AWS, Azure and GCP cost, read agentless and read-only with SOC 2, ISO and GDPR coverage. Customers using Amnic for cloud and AI cost report documented savings in the range of 30% to 50%, with named users including LambdaTest, Nanonets and Open Financial. It is the same monitoring approach buyers weigh when they compare FinOps tools for AI cost management.
Put the OpenAI meter where finance can see it
Native dashboards show you spend after it happens, and most observability tools were built for engineers debugging latency rather than the person who answers for the bill.
Amnic monitors OpenAI cost per call, attributes it to the team, feature and customer behind it, alerts before the invoice, and keeps it next to your cloud spend in one FinOps view. Request a demo and see your OpenAI and cloud spend in a single picture.
Frequently Asked Questions
What is an OpenAI cost monitoring tool?
It is a platform that tracks your OpenAI API spend in close to real time, broken down by model, key, team or feature, and alerts you when costs move. It reads OpenAI's Usage and Costs APIs plus request-level data so spend can be traced to the workload that caused it.
Can I monitor OpenAI costs for free?
Yes. The native OpenAI Usage and Cost Dashboard is included with every account and shows a live cost chart, per-model usage and CSV export. It has no anomaly detection or per-customer attribution, so most teams add a dedicated tool once spend matters.
Does OpenAI have built-in spend limits?
OpenAI offers Spend Controls: a monthly budget threshold and project-level budget alerts that email you when spend crosses a set amount. It no longer enforces a hard cap that blocks requests, so the alert notifies but does not stop a runaway key. Enforced budgets need a third-party tool.
What is the difference between monitoring and optimizing OpenAI cost?
Monitoring watches the spend and alerts you when it moves through dashboards, attribution and anomaly detection. Optimizing reduces the bill through caching, model routing and batching. Monitoring tells you what is happening; optimization changes it.
How do OpenAI cost monitoring tools track spend?
They read OpenAI's Usage API and Costs API for organization-level token and dollar data, and capture request-level telemetry at the application for per-call detail. Joining the two lets a tool map the invoice back to a specific model, team, feature or customer.
Does Amnic monitor OpenAI cost alongside cloud spend?
Yes. Amnic tracks OpenAI tokens per call and shows that spend next to AWS, Azure and GCP cost in one view. It attributes spend to teams and features, sets budgets per model, and flags anomalies before the invoice, all read-only and agentless.
Which OpenAI cost monitoring tool is best for finance teams?
Amnic suits finance and FinOps teams because it delivers attribution by team, feature and customer, budgets that alert before the invoice, and one view across AI and cloud. Engineering-first tools like Datadog and Helicone give deeper per-request traces but lighter finance chargeback.
Better visibility and management into AI Tokens?
Start with a 30 day trial
Connect leading LLMs
24 hour time to value
Stay ahead of AI Spend

Make AI spend visible, controllable, and accountable.
Gain insights into your AI token costs at a team, customer, business unit and individual user level to measure and manage AI utilization.
Recommended Articles

8 Best Llama Cost Management Tools in 2026
Read More

8 Best Amazon Bedrock Cost Optimization Tools for 2026
Read More

7 Best Amazon Bedrock Cost Monitoring Tools
Read More

8 Best Gemini Cost Visibility Tools for 2026
Read More

7 Best Multimodal Cost Optimization Tools for 2026
Read More

5 Best Anthropic Cost Allocation Tools for 2026
Read More


