7 Best Amazon Bedrock Cost Monitoring Tools
16 min read
Tools

Table of Contents
Comparing the top Amazon Bedrock cost monitoring tools are 1. Amnic, 2. AWS Native Cost Tooling, 3. Vantage, 4. CloudZero, 5. Datadog, 6. Finout, 7. nOps.
Amazon Bedrock bills per input token, per output token and per feature and those charges land inside a much larger AWS invoice. A single agent workflow can quietly consume five to ten times the tokens you expected and Knowledge Bases, Guardrails and CloudWatch logging each add their own line items on top of model inference. Teams rarely notice until the monthly bill arrives.
An Amazon Bedrock cost monitoring tool answers the question finance keeps asking: who spent what, on which model and why did it move. Native AWS tooling covers most of this for free, delivering aggregated dollars per usage type per day into Cost Explorer and Cost and Usage Report 2.0. A dedicated tool adds the faster refresh, per-customer allocation and anomaly alerts that raw billing exports miss.
Amnic sits in the FinOps category rather than the AI-only category. It ingests your AWS Cost and Usage Report, so Bedrock spend lands beside EC2, S3 and the rest of the bill in one FinOps platform, then maps it to teams and cost centers using the same tags you already apply. That single-pane approach is why it opens this comparison, not any claim about being best for every team.
Top 7 Amazon Bedrock Cost Monitoring Tools
Amnic: Agentless FinOps platform that ingests AWS CUR and allocates Bedrock spend to teams and cost centers with built-in anomaly alerts.
AWS Native Cost Tooling: The free build-it baseline combining Cost Explorer, CUR 2.0, inference profiles, IAM principal attribution, CloudWatch and Budgets.
Vantage: Cost visibility platform that filters Bedrock charges and slices them by model or tag across many cloud providers.
CloudZero: Cost intelligence platform focused on unit economics, mapping Bedrock spend to customers, features and products.
Datadog: Observability suite that pairs Cloud Cost Management with LLM Observability for token, latency and cost per model.
Finout: FinOps platform with a Bedrock cost angle, tracking token-level usage through virtual tags across the whole cloud bill.
nOps: AWS-centric cost platform that folds Bedrock spend into its commitment and rightsizing workflow.
What are Amazon Bedrock cost monitoring tools?
Amazon Bedrock cost monitoring tools track how much your generative AI usage costs, attribute that cost to an owner and alert you when spend moves in a way you did not plan. They answer three recurring questions: which model or feature drove the bill, which team or customer should carry it and whether today's spend is normal.
Under the hood, these tools pull from two data planes. The billing plane is AWS Cost Explorer and Cost and Usage Report 2.0, where native attribution methods such as IAM principal attribution and application inference profiles deliver dollars aggregated per usage type per day.
The usage plane is CloudWatch metrics and model invocation logs, which carry per-call token counts in near real time. Strong tools reconcile both so a dollar figure ties back to the exact model, request and identity that produced it.
The buyer is usually a FinOps lead, a platform engineer or a finance partner who owns the AWS bill and now sees Bedrock as its fastest growing line. They need clean cost attribution by team and customer, not just a total. For that reader the choice is less about whether a tool can read Bedrock charges and more about how fast it refreshes, how deep it allocates and whether it shows Bedrock beside the rest of the cloud stack.
Amazon Bedrock Cost Monitoring Tools Comparison Table
Information reflects vendor sources. Confirm current pricing and feature availability with each vendor before you buy.
Tool | Bedrock Coverage | Key Features | Free Option | Pricing | Best For |
|---|---|---|---|---|---|
Amnic | AWS CUR ingestion + tag allocation | Cost allocation, anomaly alerts, budgets, unified AWS view | Demo available | ~0.25 to 1 percent of monitored spend | FinOps teams unifying Bedrock with cloud cost |
AWS Native | Native, full | IAM principal attribution, inference profiles, CloudWatch, Budgets | Yes, included | Free | Teams comfortable building and maintaining it |
Vantage | Bedrock charge filtering | Model and tag slicing, multi-provider, budgets | Free tier | Scales with tracked spend | Engineering-led cost visibility |
CloudZero | Billing ingestion + allocation | Cost per customer, cost per feature, shared cost splits | No public tier | Custom quote | Unit economics and pricing decisions |
Datadog | Integration + LLM Observability | Runtime metrics, token and cost per model, traces | Trial | Per host and per feature | Teams already standardized on Datadog |
Finout | Token-level tracking | Virtual tags, unified bill, forecasting, anomaly alerts | No public tier | Custom quote | Vendor-neutral shared cost allocation |
nOps | Bedrock spend in AWS view | Tag allocation, anomaly detection, commitment planning | Free to start | Share of realized savings | AWS-centric optimization workflows |
How We Evaluated the Tools
Refresh speed: how close to real time the token and cost data lands, since Cost Explorer refreshes only about once a day.
Attribution depth: whether spend splits by model, feature, customer and environment, not just by IAM principal.
Scope: whether Bedrock rolls up across many AWS accounts and sits beside the rest of the cloud bill.
Alerting: whether the tool ships anomaly detection and fires budget alerts before the invoice closes, not days after.
Setup effort: how much engineering work stands between install and a usable per-team view.
Honesty of pricing: whether the cost model is transparent and predictable for the spend you monitor.
The 7 Best Amazon Bedrock Cost Monitoring Tools
1. Amnic
Best for: FinOps and platform teams that want Bedrock spend allocated to teams and cost centers inside one view of the whole AWS bill.
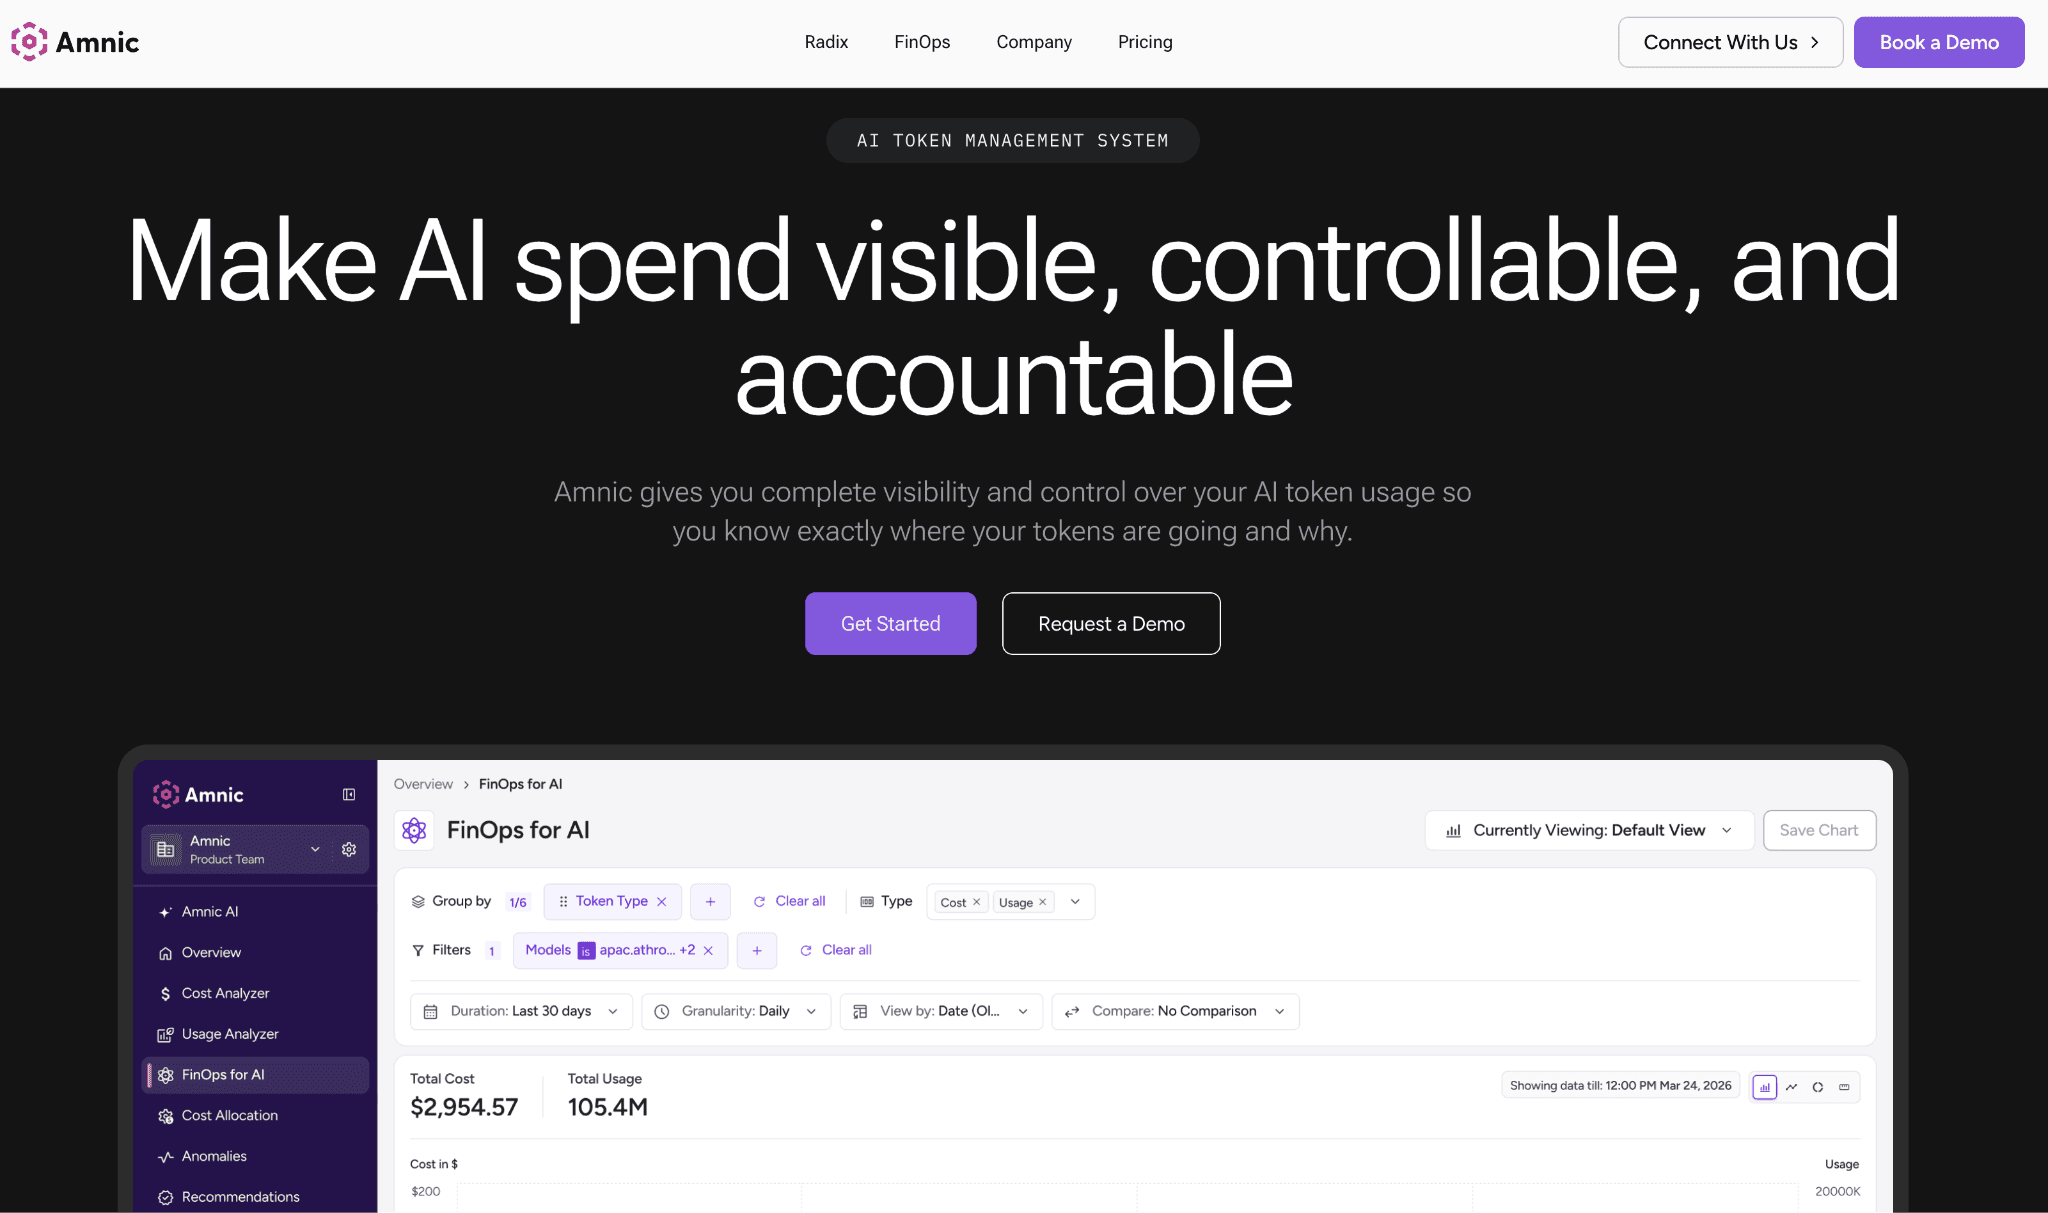
Amnic is an agentless, read-only FinOps platform that reads your AWS Cost and Usage Report and places Amazon Bedrock charges next to EC2, S3 and every other service in shared cost dashboards.
Because it works from the CUR, the tag-based attribution you set up through application inference profiles flows straight into its views without extra instrumentation. That keeps AI spend out of an aggregate services bucket and in front of the people who own the budget.
The platform builds on the same tag and account structure you already maintain to drive cost allocation, then layers automated alerting on top so a Bedrock spike surfaces the day it happens. Teams that run many linked accounts get a single rolled-up number rather than per-account math and the read-only design means no agents touch production. That combination is why finance sees one owner for every dollar of AI spend rather than a shared mystery line.
Key features
Unified cost dashboards that place Bedrock line items beside the rest of your AWS bill.
Tag and account based allocation mapping Bedrock usage to teams, products and cost centers.
Automated anomaly detection that flags a sudden Bedrock spike within the day, not at month close.
Budgets with threshold alerts routed to the team that owns the workload.
A multi-provider token view with input, output and cached token breakdowns for supported providers.
Cross-account rollups so spend across many linked AWS accounts lands in a single figure.
SOC 2, ISO and GDPR aligned access, since the platform stays read-only and agentless.
Cost views and reports that split shared spend without changing your resource tags.
Pricing: usage based, roughly 0.25 to 1 percent of the cloud spend under management. There are no per-seat fees, so cost scales with the bill you monitor rather than headcount.
Pros
One view for Bedrock plus the rest of the AWS bill, so AI spend never hides.
Agentless and read-only, which keeps security review light.
Predictable pricing tied to monitored spend.
Cons
Per-user token attribution in the AI token management module currently covers OpenAI and Anthropic direct APIs, so for Bedrock you rely on CUR tags and inference profiles rather than native per-user token rows today.
2. AWS Native Cost Tooling
Best for: teams comfortable assembling and maintaining their own cost pipeline who want zero added tool spend.
The native stack is the baseline every Bedrock team already owns. It combines Cost Explorer, Cost and Usage Report 2.0, application inference profiles, IAM principal attribution, CloudWatch metrics and AWS Budgets. AWS positions this set as capable enough to remove the need for a separate paid platform and for smaller or single-account deployments that holds.
IAM principal attribution records the caller identity for every Bedrock API call and writes the associated cost into your billing tools. The granular cost attribution feature is available at no additional cost. The trade-off is assembly and lag, since you wire the pieces together and Cost and Usage Report data lands about a day later.
Key features
IAM principal attribution that ties every Bedrock call to the user or role that made it.
Application inference profiles that apply custom cost allocation tags to on-demand model usage.
Cost Explorer filtering by the Amazon Bedrock service and grouping by tag key.
Cost and Usage Report 2.0 line-item detail with caller identity allocation data.
Model invocation logs that record per-call token counts for per-prompt analysis.
CloudWatch metrics and alarms for near real-time usage tracking.
AWS Budgets alerts before spend crosses a limit, tied to tag or service thresholds.
Pricing: free, included with your AWS account. Your only real cost is the engineering time to build the pipeline and keep it current.
Pros
No added license cost and the data comes straight from the source of truth.
Native attribution mechanisms cover per-user and per-application dollars.
Cons
You assemble and maintain it yourself, billing data lags about a day and there is no cross-cloud or multi-provider rollup.
3. Vantage
Best for: engineering-led teams that want to slice Bedrock cost by model or tag next to a broader multi-cloud bill.
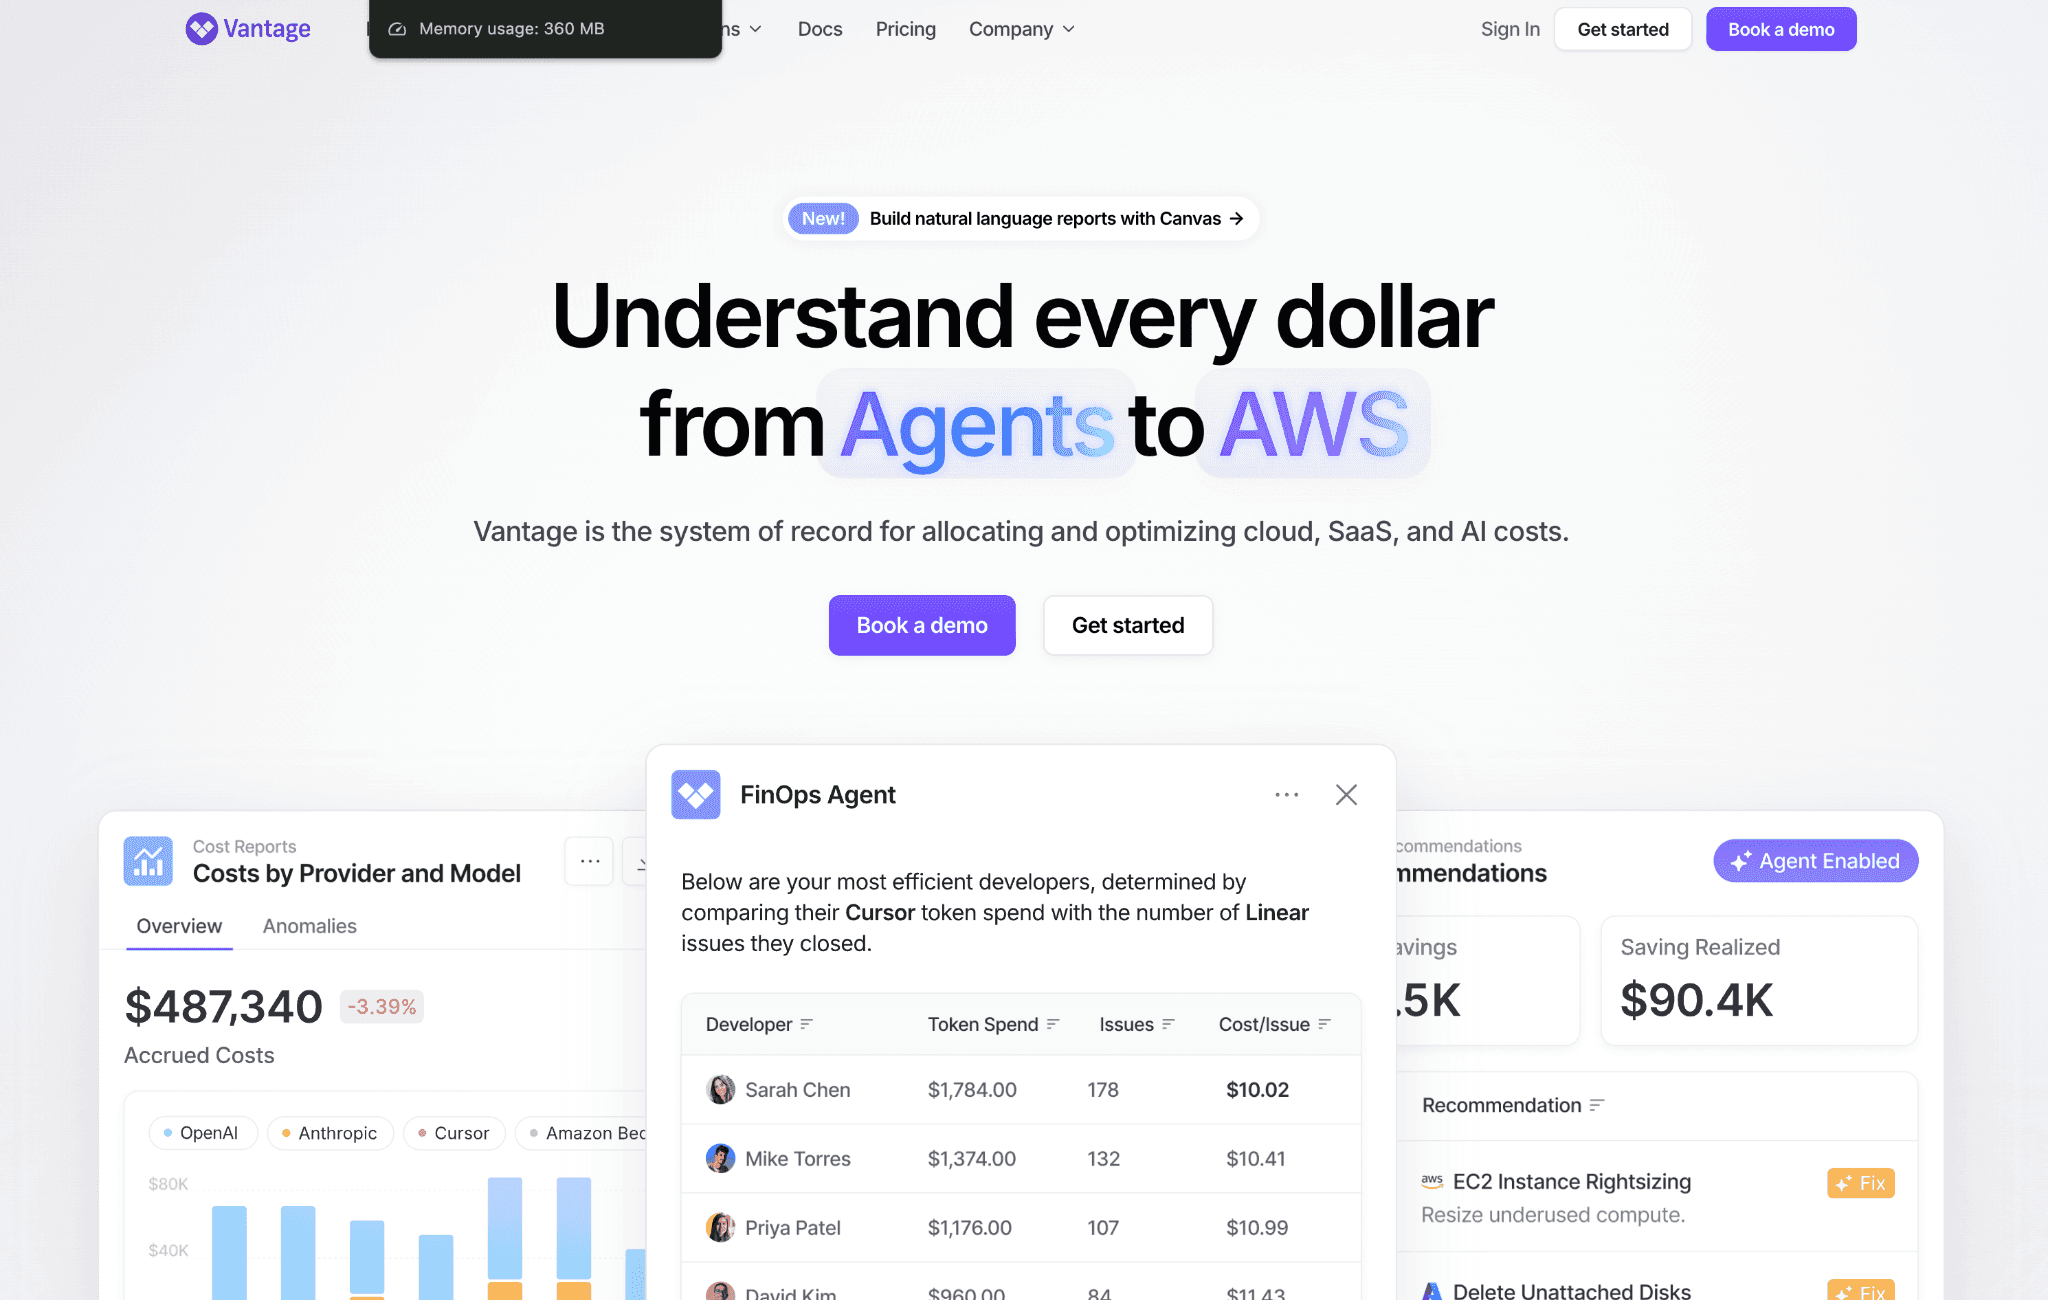
Vantage is a cloud cost visibility platform that supports many providers and lets you filter down to Amazon Bedrock charges. It groups and filters costs as granularly as your tags allow, which suits teams that want to see Bedrock spend by model or environment without building reports by hand. The view sits alongside AWS, other clouds and Kubernetes in one place.
The platform is strong on presentation and self-serve reporting, with budgets and alerts on cost movements. It leans toward showing spend clearly rather than modeling deep per-customer unit economics, so heavier chargeback work can need extra configuration.
Key features
Bedrock charge filtering with grouping as granular as the tags you apply.
Cost reports segmented by model, account and service.
Provider coverage well beyond AWS for multi-cloud teams.
Budgets and alerts on cost movements.
Resource-level cost breakdowns for shared infrastructure.
Kubernetes and container cost views alongside Bedrock.
A per-token and per-inference angle for workload-level analysis.
Pricing: free tier available, with paid plans that scale with tracked cloud spend. Larger deployments move to negotiated plans.
Pros
Clean, self-serve cost views with wide provider coverage.
A genuine free tier to start small.
Cons
Deep per-customer AI unit economics need extra setup compared with a purpose-built cost intelligence tool.
4. CloudZero
Best for: teams that need cost per customer or cost per feature to inform pricing and margin decisions.

CloudZero is a cost intelligence platform built around unit economics. It maps Bedrock spend to customers, features and products rather than only to accounts, which helps product and finance teams defend pricing and understand gross margin. It ingests AWS billing data plus SaaS and PaaS costs and applies its own rules to split shared and untagged spend.
The platform is aimed at organizations that treat cost as an engineering metric and want dashboards that align finance and engineering. It is packaged for larger teams, so smaller Bedrock projects may find it heavier than they need.
Key features
Cost per customer and cost per feature modeling across Bedrock and the wider stack.
Allocation of shared and untagged spend through a rules engine.
Ingestion of AWS billing plus PaaS and SaaS costs in one place.
Anomaly alerts on cost movements routed to owners.
Kubernetes cost tracking beside AI workloads.
Dashboards built for engineering and finance alignment.
A path to combine Bedrock with observability spend.
Pricing: custom enterprise quote based on cloud spend, with no public self-serve tier. Expect a sales-led onboarding.
Pros
Best-in-class unit economics and per-customer cost views.
Strong shared-cost allocation logic.
Cons
Priced and packaged for larger organizations, which can be too much for a small Bedrock footprint.
5. Datadog
Best for: teams already standardized on Datadog that want Bedrock cost and performance in one pane.
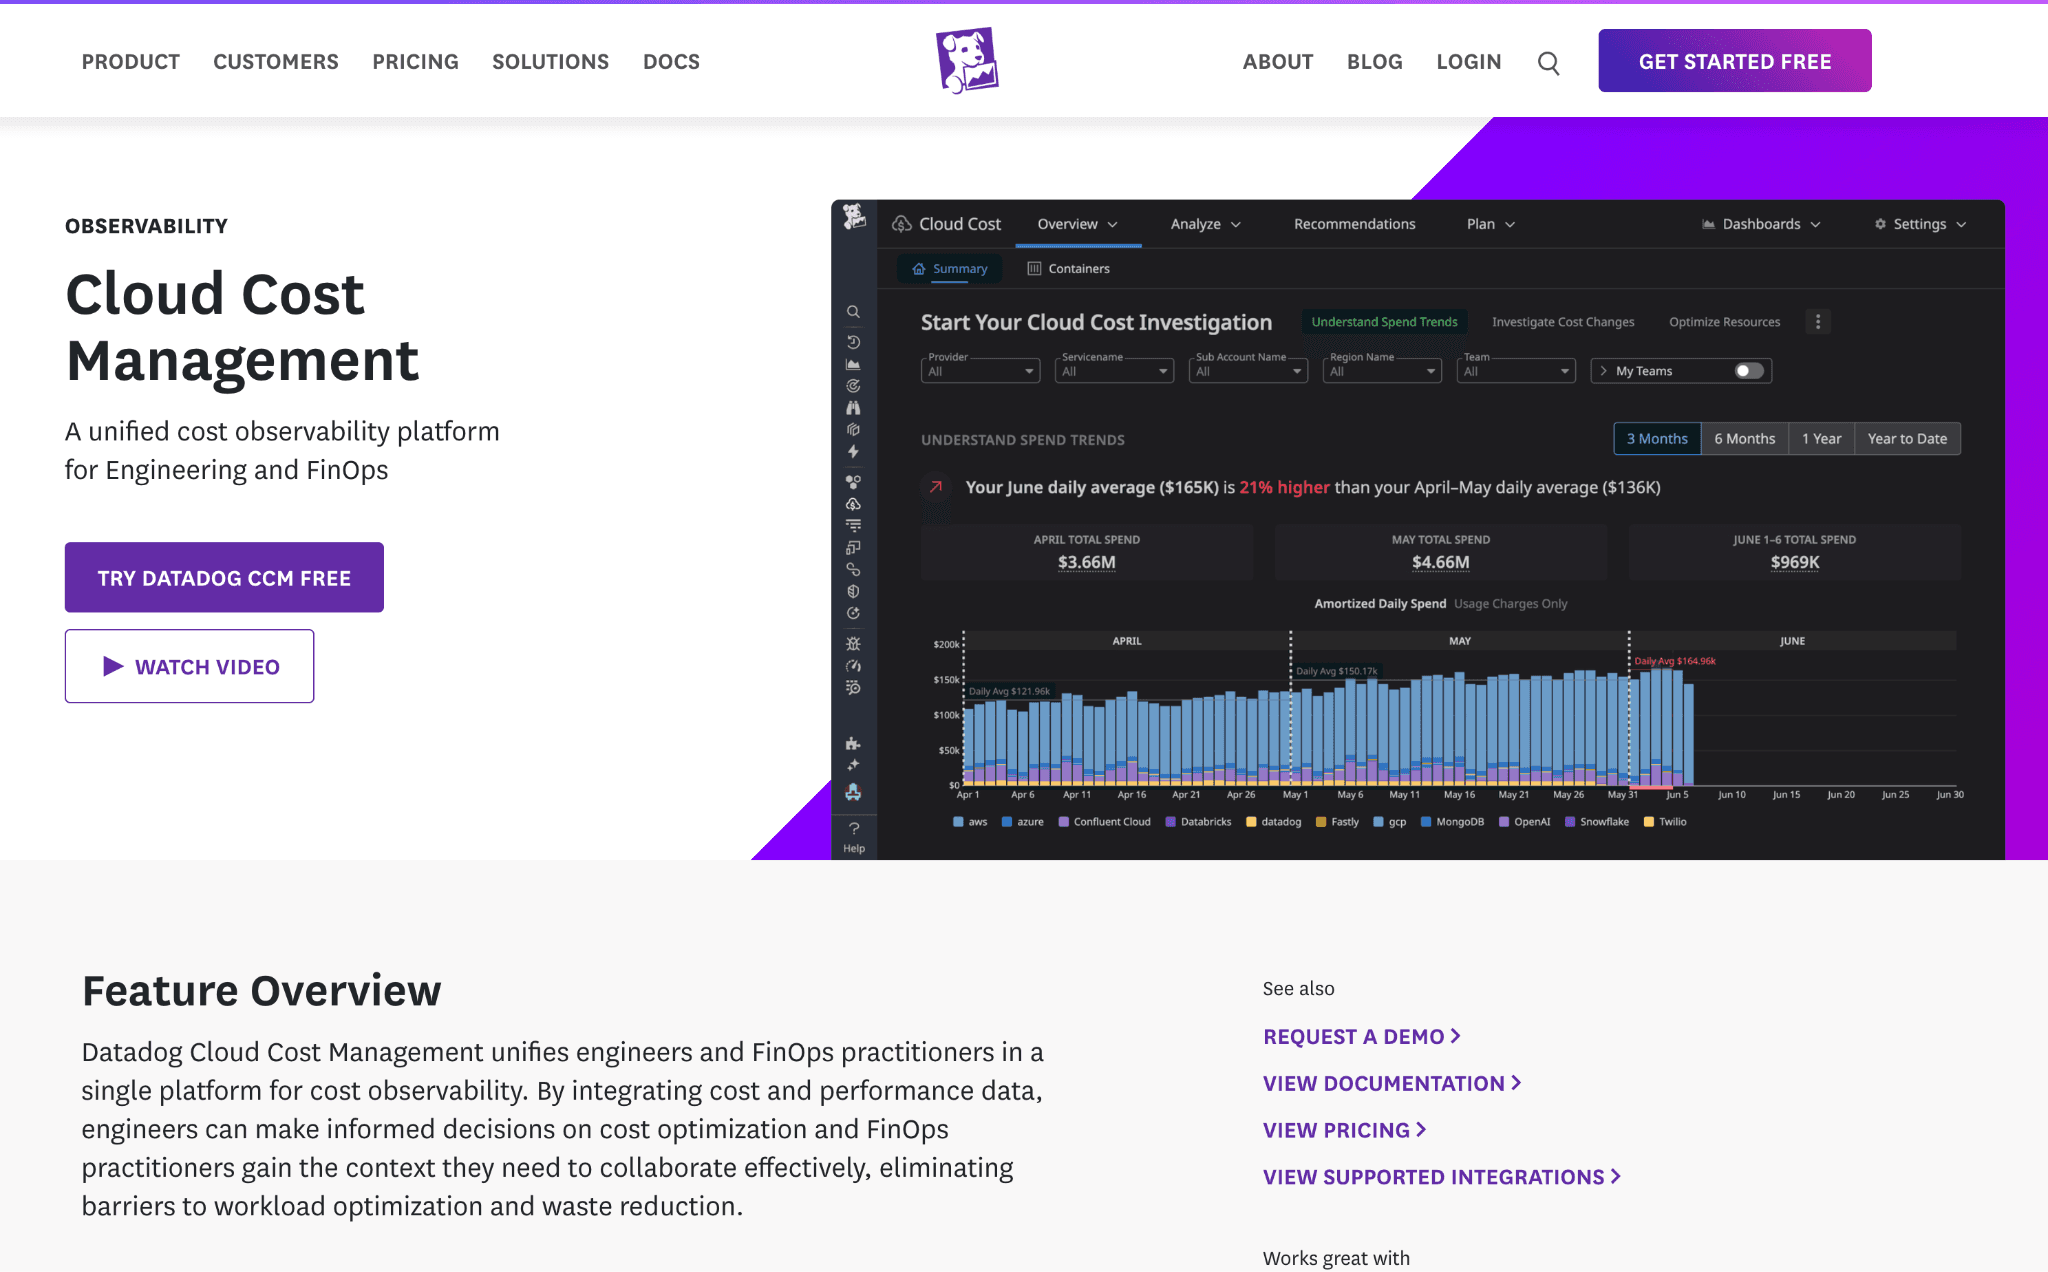
Datadog pairs Cloud Cost Management with LLM Observability and its Bedrock integration tracks invocation frequency, latency, error rate and token usage. For teams that already run Datadog, this keeps cost signals next to traces and logs, so a spend spike can be tied to the request pattern that caused it. It also connects to broader inference cost analysis across your services.
The strength is correlation between cost and application behavior in near real time. The catch is that value depends on your whole stack living in Datadog and module-based billing can climb as you add hosts and features.
Key features
Bedrock runtime metrics for invocation counts, latency and errors.
LLM Observability that ties token counts and cost to specific models.
Cloud Cost Management to blend Bedrock spend with wider AWS cost.
Correlation of cost spikes with application traces and logs.
Dashboards and monitors for near real-time alerting.
Usage attribution by model and service.
Broad integration coverage across infrastructure.
Pricing: modular, billed per host and per feature, with LLM Observability priced separately. Costs rise as you enable more modules.
Pros
Cost and performance in one place for existing Datadog users.
Near real-time correlation between spend and behavior.
Cons
Costs can climb quickly across modules and value drops if your stack is not already on Datadog.
6. Finout
Best for: teams that want vendor-neutral allocation and a shared source of truth across engineering and finance.

Finout is a FinOps platform with a Bedrock cost angle, tracking usage, model activity and token-level cost alongside the rest of the cloud bill. Its virtual tagging allocates spend without forcing changes to resource tags, which helps when historical tagging is inconsistent. That makes it a fit for teams standing up clean chargeback vs showback reporting across many services.
The platform unifies AWS, Kubernetes and SaaS costs and adds budgets, forecasting and anomaly alerts. Onboarding and virtual-tag modeling take setup effort and pricing sits at the enterprise end.
Key features
Bedrock usage and token-level cost tracking in one view.
Virtual tagging to allocate spend without changing resource tags.
A unified bill spanning AWS, Kubernetes and SaaS costs.
Shared cost splitting across teams and products.
Budgets, anomaly alerts and forecasting.
Cost per feature and per team reporting.
Savings opportunity surfacing across Bedrock and the wider stack.
Pricing: custom enterprise quote with no public pricing. Onboarding is sales-led.
Pros
Flexible virtual tagging for messy tag histories.
Strong shared-cost and forecasting features.
Cons
Onboarding and virtual-tag modeling take real setup effort before value lands.
7. nOps
Best for: AWS-centric teams that already use nOps for commitment and rightsizing and want Bedrock in the same picture.
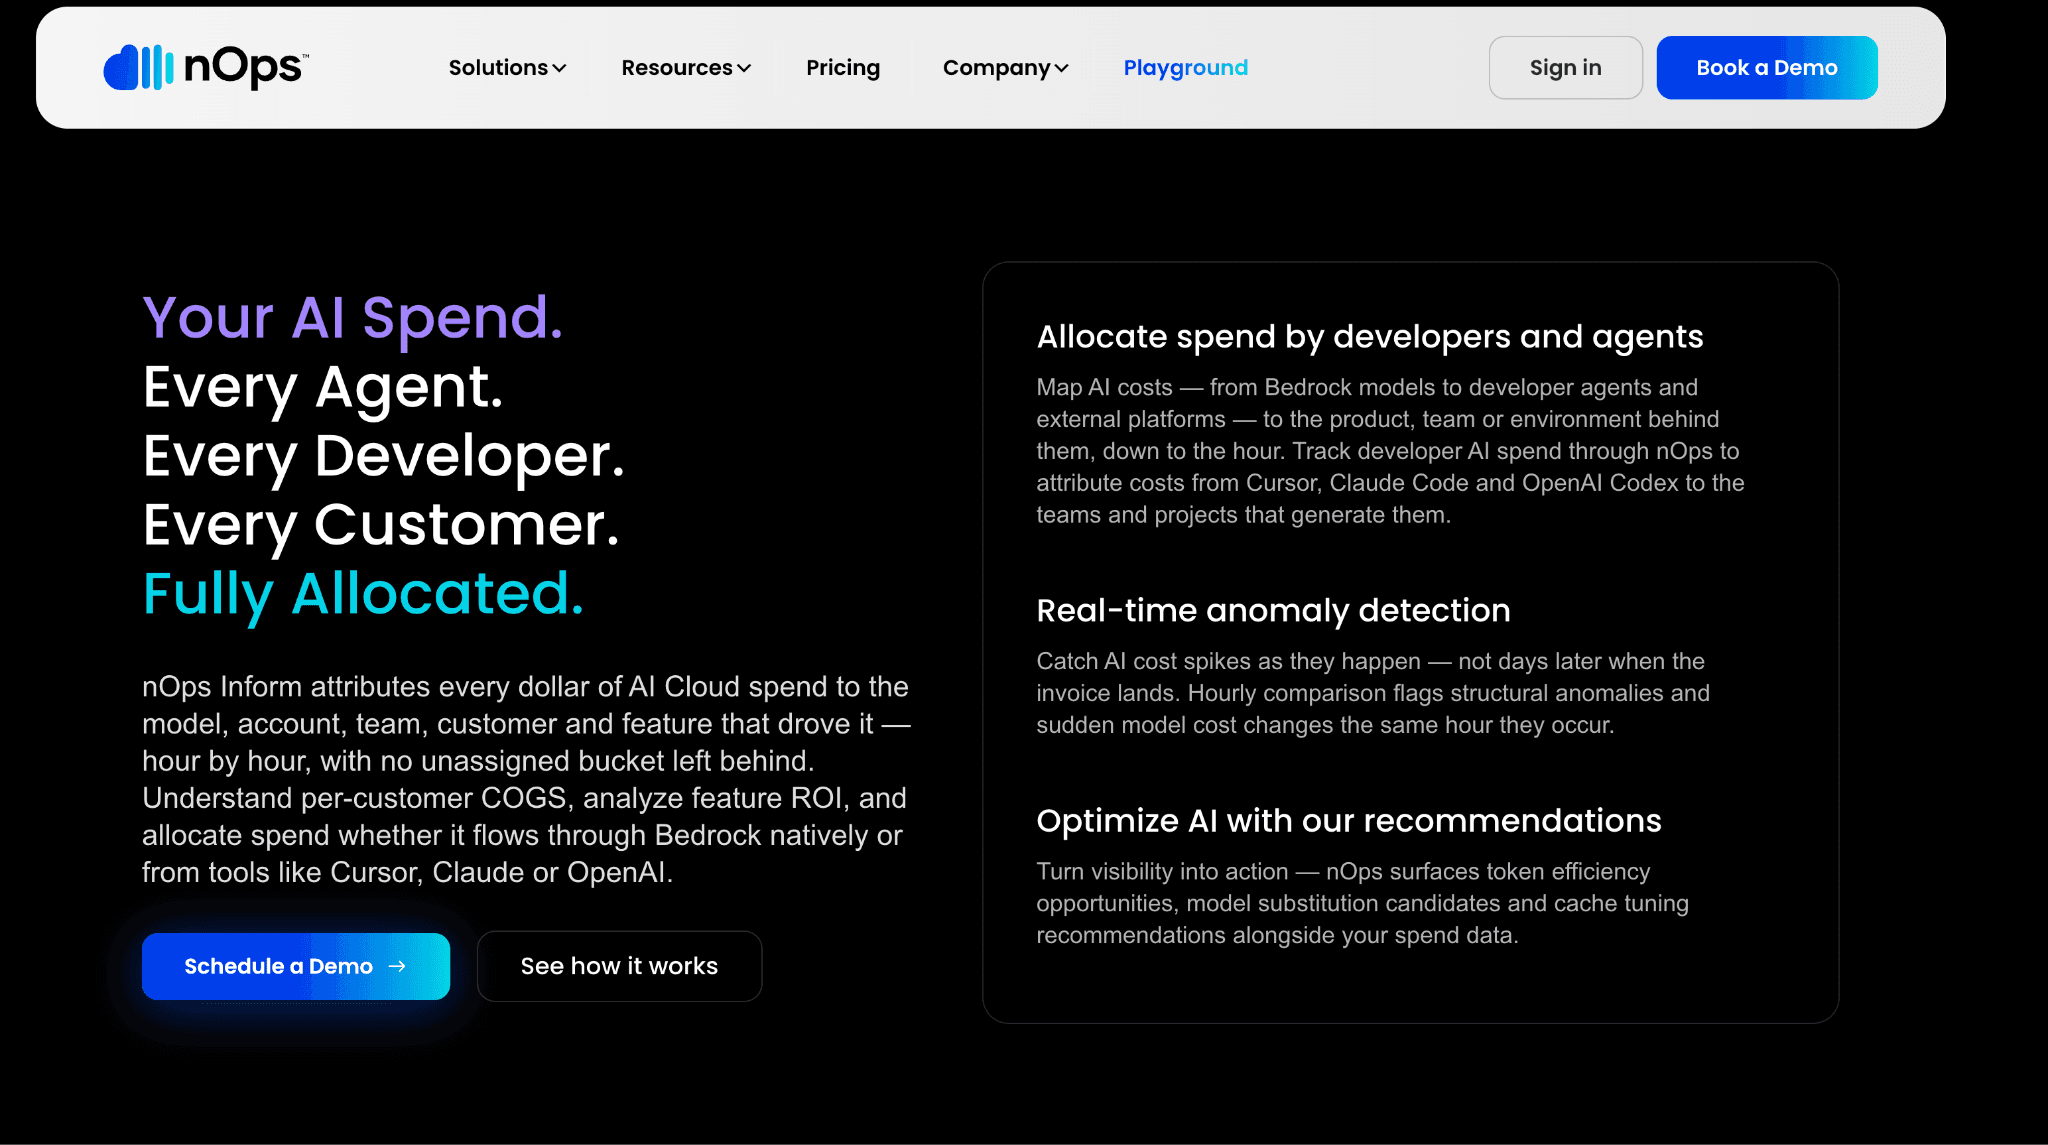
nOps added AI cost visibility for Amazon Bedrock, letting teams see Bedrock spend inside a broader set of AWS cost optimization tools and workflows. For teams that already lean on nOps for reserved-capacity and rightsizing decisions, folding Bedrock into the same console avoids another dashboard. It is deeply tied to AWS billing data.
The focus is AWS optimization rather than multi-provider AI cost, so non-AWS model spend falls outside its core view. Within AWS, it covers tag-based allocation, anomaly detection and budgets.
Key features
Bedrock spend visibility inside a wider AWS cost view.
Tag and account based cost allocation.
Anomaly detection on unexpected movements.
Budgets and threshold alerting.
Commitment and rightsizing recommendations for surrounding infrastructure.
Dashboards for engineering and finance.
Deep AWS billing integration.
Pricing: free to start, with charges historically tied to realized savings. Model varies by engagement.
Pros
Bundles Bedrock cost into an existing AWS optimization workflow.
Low barrier to start.
Cons
AWS-focused, so multi-provider LLM cost or non-AWS AI spend sits outside its core view.
How to Choose the Right Amazon Bedrock Cost Monitoring Tool
Bedrock sits inside a large AWS and multi-cloud bill: choose a FinOps platform that ingests the Cost and Usage Report so AI spend allocates beside everything else. Compare the wider field in our roundup of AI cost visibility tools to see which platforms unify AI and cloud cost.
You need cost per customer to defend pricing: choose a unit-economics tool that models shared spend down to the individual customer and product feature, then feeds those numbers into your margin analysis.
You are still picking a provider: the hosting choice shapes which native cost mechanisms you inherit, so read the OpenAI API vs Bedrock vs Vertex AI breakdown before you commit more budget to any one platform.
You already run an observability suite: extend it before buying a second platform, keep cost next to traces and only add a dedicated tool once allocation gaps start hurting your monthly reporting.
You want to cut the bill, not just watch it: once you can see clearly where the spend actually goes, pair steady monitoring with the reduction levers in our Amazon Bedrock cost optimization tools guide.
Common Mistakes When Choosing a Bedrock Cost Monitoring Tool
Even teams that pick a capable tool trip over the same avoidable errors. Watch for these before you commit.
Assuming native tooling gives per-request dollars: Cost Explorer and Cost and Usage Report only deliver aggregated dollars per usage type per day, so for per-prompt detail you need model invocation logs or a tool that reconciles them. Learn the tagging groundwork in our guide to AWS cost allocation tags.
Watching spend but never alerting: A spike you see three days late has already cost you, so treat automated anomaly detection and budget thresholds as a requirement rather than an optional extra you add later.
Ignoring input versus output token rates: Output tokens usually cost more than input tokens, so a tool that lumps them into one number hides the real driver of the bill. See the full breakdown in input vs output token pricing.
Tracking model calls but not the workload around them: Agents, retrieval and orchestration multiply token use, so pick a tool that shows the full request path rather than a single invocation in isolation.
Forgetting the supporting services: Knowledge Bases, Guardrails and verbose prompt logging add charges on top of inference, so monitor the whole workload rather than the model calls alone, including the log storage piling up in CloudWatch.
Why Decision Makers Choose Amnic for Bedrock Cost Monitoring
Amnic unifies Bedrock with the rest of the AWS bill instead of treating AI as a separate silo, so finance sees one number and one allocation model. The agentless, read-only design shortens security review and pricing tied to monitored spend keeps the cost predictable as usage grows.
Teams also monitoring Google models pair Amnic with dedicated Gemini cost visibility tools, because the value grows once you run more than one model provider. Amnic keeps Bedrock spend in the same view as the rest of your AWS bill, so no provider becomes a blind spot and one allocation model covers the whole AI portfolio without extra reconciliation work.
The outcomes are concrete. LambdaTest cut NAT and CloudWatch costs by 30 percent and MetaMap lowered EC2 costs by 33 percent after consolidating onto a single cost view. Those savings came from the same allocation and anomaly workflow that governs Bedrock spend and the discipline of tying every dollar to an owner is what makes the difference at scale rather than any single dashboard feature.
Teams that operate Bedrock at scale also lean on Amnic to connect token usage to business units and unit economics. That accountability layer, mapping spend to the teams and products that create it, is the same one that mature and well governed TokenOps programs depend on. The result is spend that maps to owners, spikes that surface early and a bill with no surprises.
Ready to monitor Amazon Bedrock spend in one place?
See every Bedrock token tied to an owner, catch spikes the day they happen and keep AI cost next to the rest of your AWS bill. Book a demo to map Amnic to your own Bedrock usage.
Frequently asked questions
Does Amazon Bedrock have a built-in cost monitoring tool?
Yes. Bedrock feeds AWS Cost Explorer, Cost and Usage Report 2.0 and AWS Budgets and supports IAM principal attribution plus application inference profiles for tagging, all at no additional cost.
How do I track Amazon Bedrock cost by team or user?
Use IAM principal attribution for per-user dollars, or application inference profiles with cost allocation tags like team and cost center. Both flow into Cost Explorer and Cost and Usage Report 2.0.
Can I see per-request token costs in Amazon Bedrock?
Native billing views only show aggregated dollars per usage type per day. For per-prompt detail, enable model invocation logging, where each call is a separate record carrying its own token counts.
Why use a third-party Bedrock cost monitoring tool over native AWS tools?
A dedicated platform adds faster than daily refresh, per-customer and per-feature unit costs, cross-account rollups, automatic anomaly alerts and a single view that blends Bedrock with the rest of your cloud spend.
Do native Amazon Bedrock cost tools cost extra?
No. IAM principal attribution, application inference profiles, cost allocation tags, CloudWatch metrics and AWS Budgets are all included at no additional cost, though you assemble and maintain them yourself.
How quickly does Amazon Bedrock cost data update?
Cost Explorer and Cost and Usage Report data refresh roughly once a day. CloudWatch metrics and model invocation logs update far faster, which is why teams add a monitoring platform for near real-time alerting.
Better visibility and management into AI Tokens?
Start with a 30 day trial
Connect leading LLMs
24 hour time to value
Stay ahead of AI Spend

Make AI spend visible, controllable, and accountable.
Gain insights into your AI token costs at a team, customer, business unit and individual user level to measure and manage AI utilization.
Recommended Articles

8 Best Llama Cost Management Tools in 2026
Read More

8 Best Amazon Bedrock Cost Optimization Tools for 2026
Read More

8 Best Gemini Cost Visibility Tools for 2026
Read More

7 Best Multimodal Cost Optimization Tools for 2026
Read More

5 Best Anthropic Cost Allocation Tools for 2026
Read More

8 Best AI Cost Optimization Tools for Startups in 2026
Read More


