7 Best Cloud Cost Visibility Software in 2026 (Compared)
15 min read
Tools
Cost Visibility

Table of Contents
Comparing the best cloud cost visibility tools for 2026: 1. Amnic, 2. Vantage, 3. CloudZero, 4. Apptio Cloudability, 5. Datadog Cloud Cost Management, 6. Harness Cloud Cost Management, 7. nOps.
Cloud bills do not shrink because someone reviews a spreadsheet at month-end. They shrink when every team can see exactly which S3 storage class is burning money, which NAT Gateway is processing $0.045 per GB in silence, which GPU node sits at 12% utilization, and which Bedrock model quadrupled its inference cost after a deployment last Tuesday. That is what cloud cost visibility software is built to surface.
The tools below are ranked on how deep their visibility actually goes, including compute, storage tiers, network egress, Kubernetes containers, and AI workloads, not on how many dashboards they ship.
Top Cloud Cost Visibility Software in 2026
Amnic: Multi-cloud cost visibility software that surfaces AWS, Azure, GCP, Oracle, and Alibaba spend at the resource level, with storage tier breakdowns, GPU and AI token tracking, and network egress visibility, all through four AI agents and read-only access.
Vantage: Self-serve cloud cost visibility tool with a no-expiry free tier and 30+ integrations that join AWS, Azure, GCP, Snowflake, OpenAI, and Anthropic spend in one normalized dashboard.
CloudZero: Cloud cost visibility platform that maps spend to product features, customers, and deployments using a code-driven allocation engine, with anomaly detection comparing 36 hours of spend against 12 months of history.
Apptio Cloudability: Enterprise cloud cost visibility software that produces finance-grade chargeback and showback reports across AWS, Azure, and GCP, with automated commitment program management.
Datadog Cloud Cost Management - Cloud cost visibility add-on that surfaces AWS, Azure, GCP, and OCI spend inside the same dashboards as APM traces, logs, and infrastructure metrics.
Harness Cloud Cost Management - Cloud cost visibility platform embedded in the Harness CI/CD workflow, with AutoStopping for idle non-production environments and pipeline-level cost attribution.
nOps: AWS-first cloud cost visibility platform with Kubernetes container-level allocation matched to the CUR file at pod level, plus automated commitment management on a savings-share model.
What Is Cloud Cost Visibility Software?
Cloud cost visibility software is a platform that pulls billing and usage data from cloud providers and breaks it down by team, product, storage tier, network path, and resource ID, in a single dashboard that finance and engineering can both read. The goal is not just knowing the total cloud bill but knowing exactly which byte, which GPU hour, and which NAT Gateway data processing charge drove it.
On the technical side, it ingests Cost and Usage Reports from AWS, billing exports from Azure and GCP, and Kubernetes pod telemetry. It normalizes that data into one model, maps shared costs like inter-AZ traffic and multi-tenant databases to the teams consuming them using configurable split rules, and layers on anomaly detection so a cost spike that started three hours ago gets flagged before it compounds over a 30-day billing cycle.
For a FinOps lead, SRE, or CFO at a company running material cloud workloads, the question cloud cost visibility software must answer every morning is this: "What changed in our spend, where did it change, which team owns it, and is it expected?" A tool that cannot answer that question at the storage-tier, network-path, and GPU-node level is still leaving significant costs dark.
Cloud Cost Visibility Software Comparison for 2026
Pricing and visibility data reflect vendor websites and verified review sources as of May 2026.
Tool | Visibility Depth | AI Cost Analysis | Free Access | Best Fit |
1. Amnic | Compute, storage class and operation level (S3/Blob/GCS), NAT and cross-AZ network, GPU node hours, Bedrock token spend, Kubernetes pod and PVC | Four agents (X-Ray, Insights, Governance, Reporting) with natural-language cost queries | 14-day Runtime Accountability Audit, read-only | Multi-cloud teams needing full-stack visibility across compute, storage, network, and AI |
2. Vantage | Compute, network cost reports, Kubernetes, 30+ SaaS including OpenAI and Anthropic, storage at the bucket level | MCP server for ChatGPT and Claude queries | Free Starter tier (no expiry) up to $2,500 cloud spend | Startups and SMBs wanting fast self-serve multi-cloud visibility with SaaS cost joined |
3. CloudZero | Compute and service-level across 50+ providers, product and customer cost dimensions, Kubernetes namespace level | AI Hub inside Claude Code and agentic tools | No free trial; enterprise contracts only | SaaS engineering teams mapping spend to product features and cost per customer |
4. Apptio Cloudability | Multi-cloud compute, container cost, reservation and commitment coverage, chargeback allocation | Limited; roadmap item per Gartner users | No; IBM enterprise agreement only | Large enterprise FinOps teams running monthly finance reviews with chargeback to BUs |
5. Datadog Cloud Cost Management | AWS, Azure, GCP, and OCI spend joined with APM and log data; container cost; tag-based allocation | Statistical anomaly detection on cost metrics | 14-day trial via Datadog platform | SREs already on Datadog tracing cost spikes back to deployments and service changes |
6. Harness Cloud Cost Management | Compute, Kubernetes pod and namespace, pipeline and deployment-level cost, idle environment detection | AI recommendations and conversational FinOps | Free starter tier; paid tiers are contact-sales | Engineering teams already on Harness who want cost visible inside CI/CD workflows |
7. nOps | AWS compute, Kubernetes container and pod level (100% CUR-matched), GenAI spend, multi-cloud summary | Clara AI FinOps analyst for natural-language queries | 14-day free trial on the visibility product | AWS-heavy teams needing Kubernetes allocation and automated commitment purchasing |
How We Evaluated the Best Cloud Cost Visibility Tools
A cloud cost visibility platform earns its place in the stack by answering the questions that native tools cannot: Why did our S3 bill jump 30%? Which team owns the NAT Gateway processing charges? How much did our Bedrock inference cost per model last week?
We scored each tool against six criteria:
Storage cost visibility depth: Does it break down S3, Azure Blob, and GCS by storage class (Standard vs. Infrequent Access vs. Glacier), by operation type (PUT, GET, LIST), and by bucket or prefix?
Network cost visibility: Does it surface NAT Gateway hourly charges and per-GB processing fees, cross-AZ data transfer, and inter-region egress separately from compute?
GPU and AI workload visibility: Does it track GPU node hours, GPU memory utilization cost, per-model token spend, and inference cost per request type?
Multi-cloud allocation accuracy: Does it attribute shared services across AWS, Azure, and GCP to the teams and products consuming them, even without perfect native tags?
Time to first insight: How many hours from signup to a usable, allocated cost dashboard?
Verified customer outcomes: Are there named customers with documented savings percentages from authoritative sources?
7 Best Cloud Cost Visibility Software in 2026
1. Amnic
Best for: Multi-cloud engineering and finance teams that need full-stack cloud cost visibility across compute, storage tiers, network paths, Kubernetes containers, and GPU and AI workloads, deployed read-only without touching your cloud infrastructure.
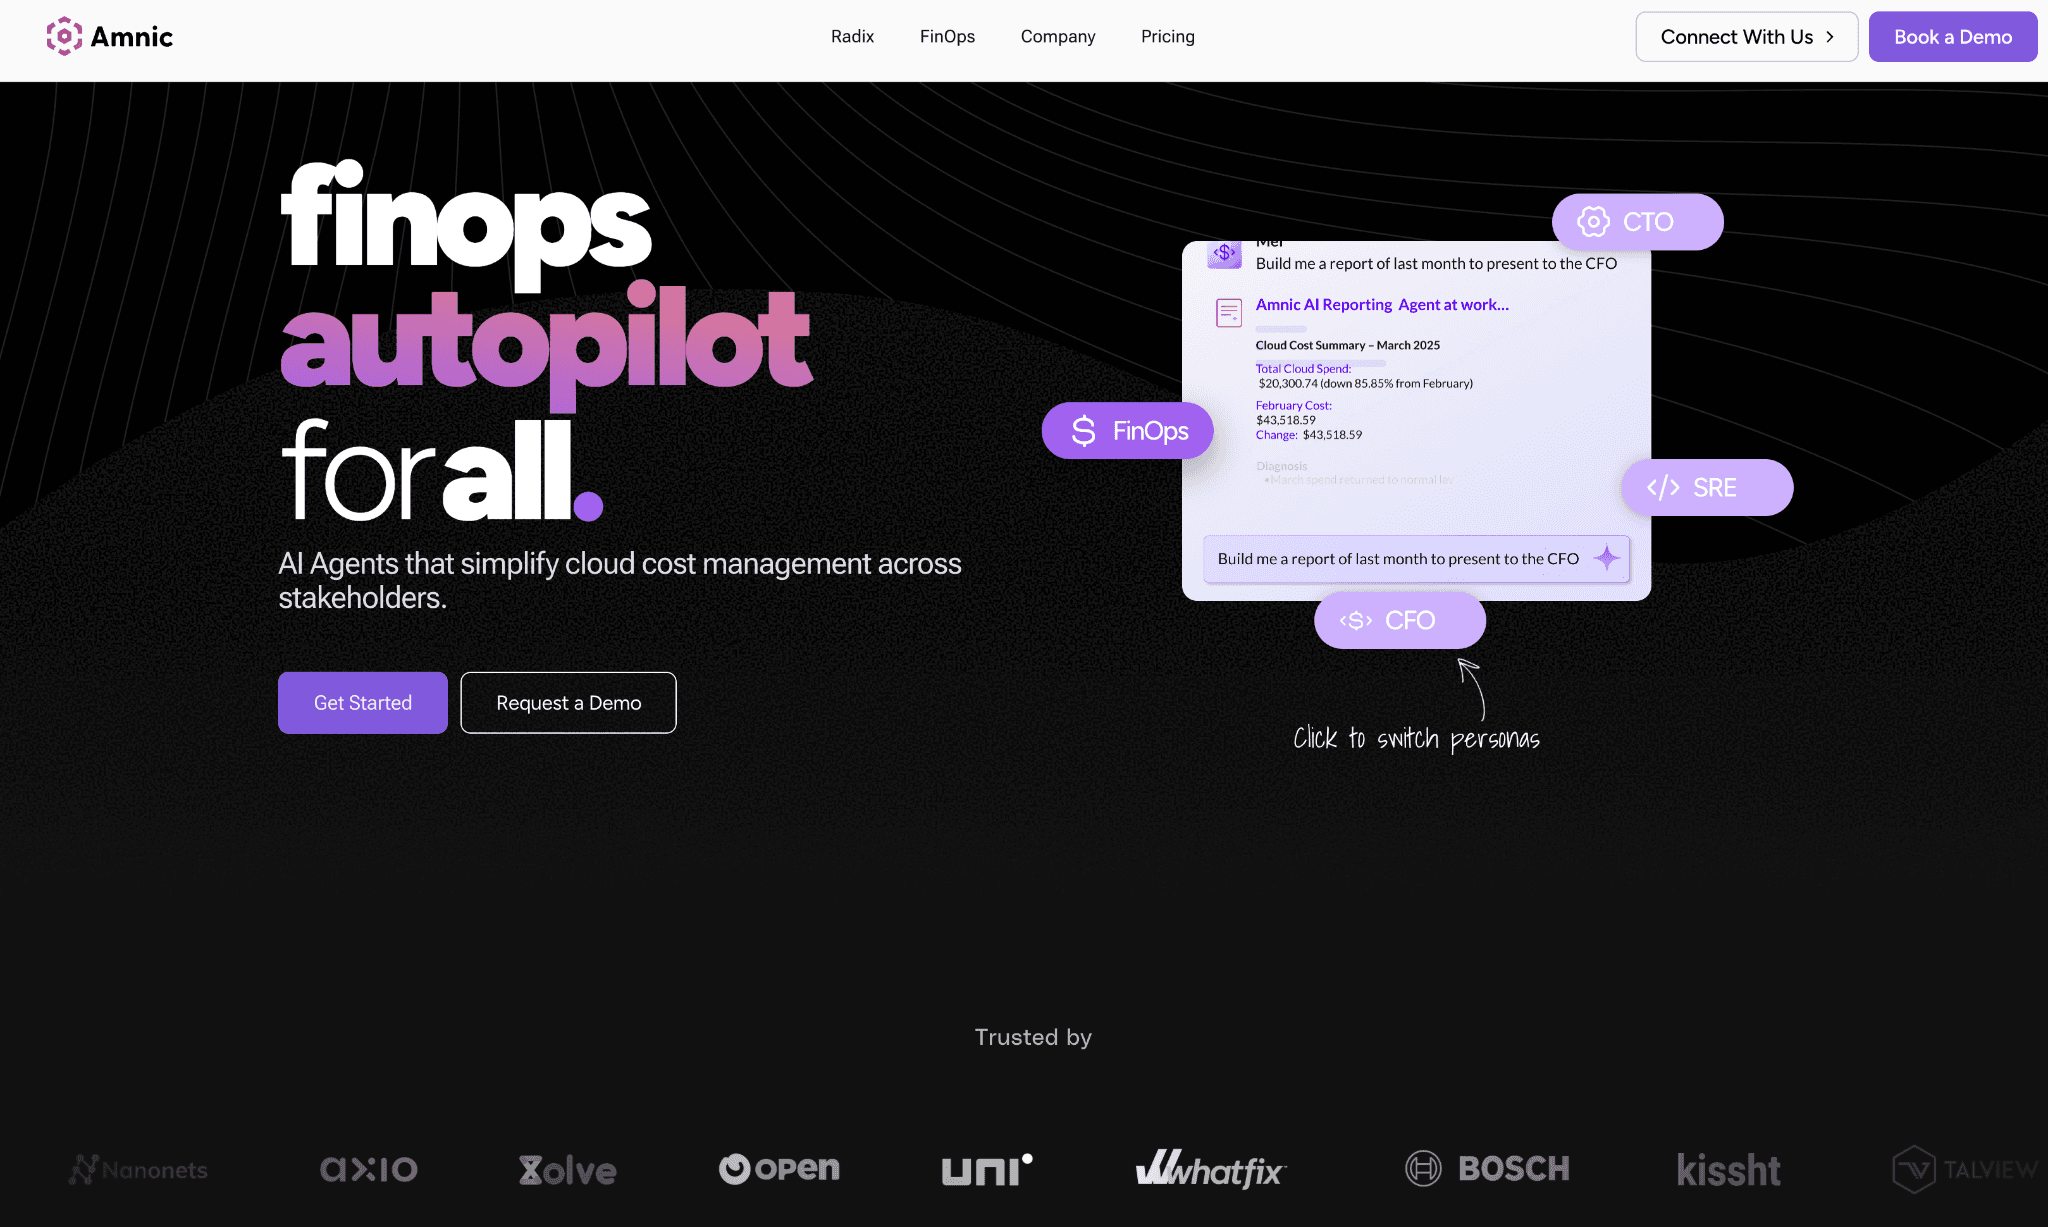
Amnic is a cloud cost management platform built so that every stakeholder, from the CFO who wants cost per customer to the SRE who wants to know which pod caused a spike on Thursday at 2 AM, works from the same data. It covers AWS, Azure, GCP, Oracle, and Alibaba and goes past account-level summaries to surface the storage class, the network path, and the GPU memory cost that native tools flatten into a single line.
The platform takes read-only billing and monitoring access, with agentless deployment. From the first hour of connection, teams can see why their bill changed and which resource owns the difference.
Key features specific to cloud cost visibility:
Storage cost visibility: S3 broken down by storage class (Standard, Infrequent Access, Glacier, Intelligent-Tiering), by operation type (PUT, COPY, LIST, GET, SELECT each priced differently), and by bucket and prefix, surfacing where missing lifecycle policies inflate the bill. Azure Blob and GCS storage tiers covered under Azure Blob storage costs visibility.
Network cost visibility: NAT Gateway charges broken down into the hourly fee and the per-GB data processing fee separately, cross-AZ transfer cost by service and team, and inter-region egress attributed to the workload generating it rather than rolled into EC2 Other. Uses VPC Flow Logs integration to map network spend to source service.
GPU and AI workload visibility: GPU node-hours tracked at the Kubernetes pod and node pool level, with GPU memory utilization as a cost driver, not just instance-hour billing. Amazon Bedrock tracked by model, by request type, and by token volume with per-model cost breakdown. OpenAI and Anthropic coverage via the AI token management module.
Kubernetes cost visibility: Container, pod, namespace, node pool, and PVC-level attribution with Kubernetes cost management rightsizing recommendations at the workload level.
Cost anomaly detection: Anomaly detection compares spend in real time against baselines at the tag, service, and product level. An AI storage anomaly that catches objects being uploaded to Standard when they should go directly to Infrequent Access is not a general alert; it is a specific cost leak tied to a policy gap.
Virtual tags: Normalizes inconsistent native tags like "prod", "production", and "PROD" into one attribution rule without infrastructure changes, so cost visibility does not have a 20% unallocated bucket.
Multi-cloud cost allocation: Shared infrastructure split rules (fixed percentage, proportional, usage-based) for NAT gateways, data platforms, and multi-tenant services, so every dollar is attributed.
Unit economics: Cost per customer, cost per inference call, cost per storage terabyte served, tied to business metrics rather than cloud taxonomy.
Cloud cost forecasting: Visibility feeds into forecasts at the service, storage class, and AI workload level, so the finance team is not surprised at month-end.
Pricing:
Amnic is custom-priced based on cloud spend and team size, with a 14-day Runtime Accountability Audit at no cost, read-only, zero commitment. Volume discounts apply above $5M annual cloud spend. All plans include a dedicated Customer Success Manager. AI Token Management is available as a standalone module from $999 per month.
Pros (sourced from G2, Capterra, and Gartner Peer Insights):
Cost Analytics gives teams the ability to slice spend across resources and create custom dashboards with custom filters, which is the capability FinOps analysts need most for daily visibility work (G2 verified review).
Replaces multiple fragmented FinOps tools as a single platform, with initial integration taking a few hours (G2 verified review).
Anomaly detection is praised for catching cost spikes fast, with reviewers specifically calling it out alongside rightsizing recommendations as the two features that drive savings decisions (Capterra verified review).
Simple visuals make spotting savings opportunities straightforward; reviewers say they can find what they need in a single click (Capterra verified review).
Read-only architecture clears security review in days, a documented differentiator for enterprises where write-access tools stall for months in approval queues.
Available on AWS Marketplace in the AI Agents and Tools category, simplifying procurement for AWS-committed buyers.
Cons (sourced from G2 and Capterra verified reviews):
Cost allocation documentation needs improvement; verified reviewers on G2 specifically called out the allocation feature as requiring more guidance to configure effectively.
Some users on Capterra noted limited customization compared to what they expected on advanced reporting views.
OpenAI and Anthropic model rightsizing is on the roadmap; Bedrock tracking is live, so teams that need active rightsizing of external LLM usage should confirm the timeline during evaluation.
Pricing scales with monitored cloud spend, so large enterprises should negotiate a spend cap at the contract stage to avoid scaling surprises.
Start with a 30-day no-cost trial
2. Vantage
Best for: Startups and mid-market teams that want a cloud cost visibility tool running on the first day, with a free tier that does not expire and 30+ integrations that bring Snowflake, OpenAI, and Anthropic spend into the same view as AWS, Azure, and GCP.
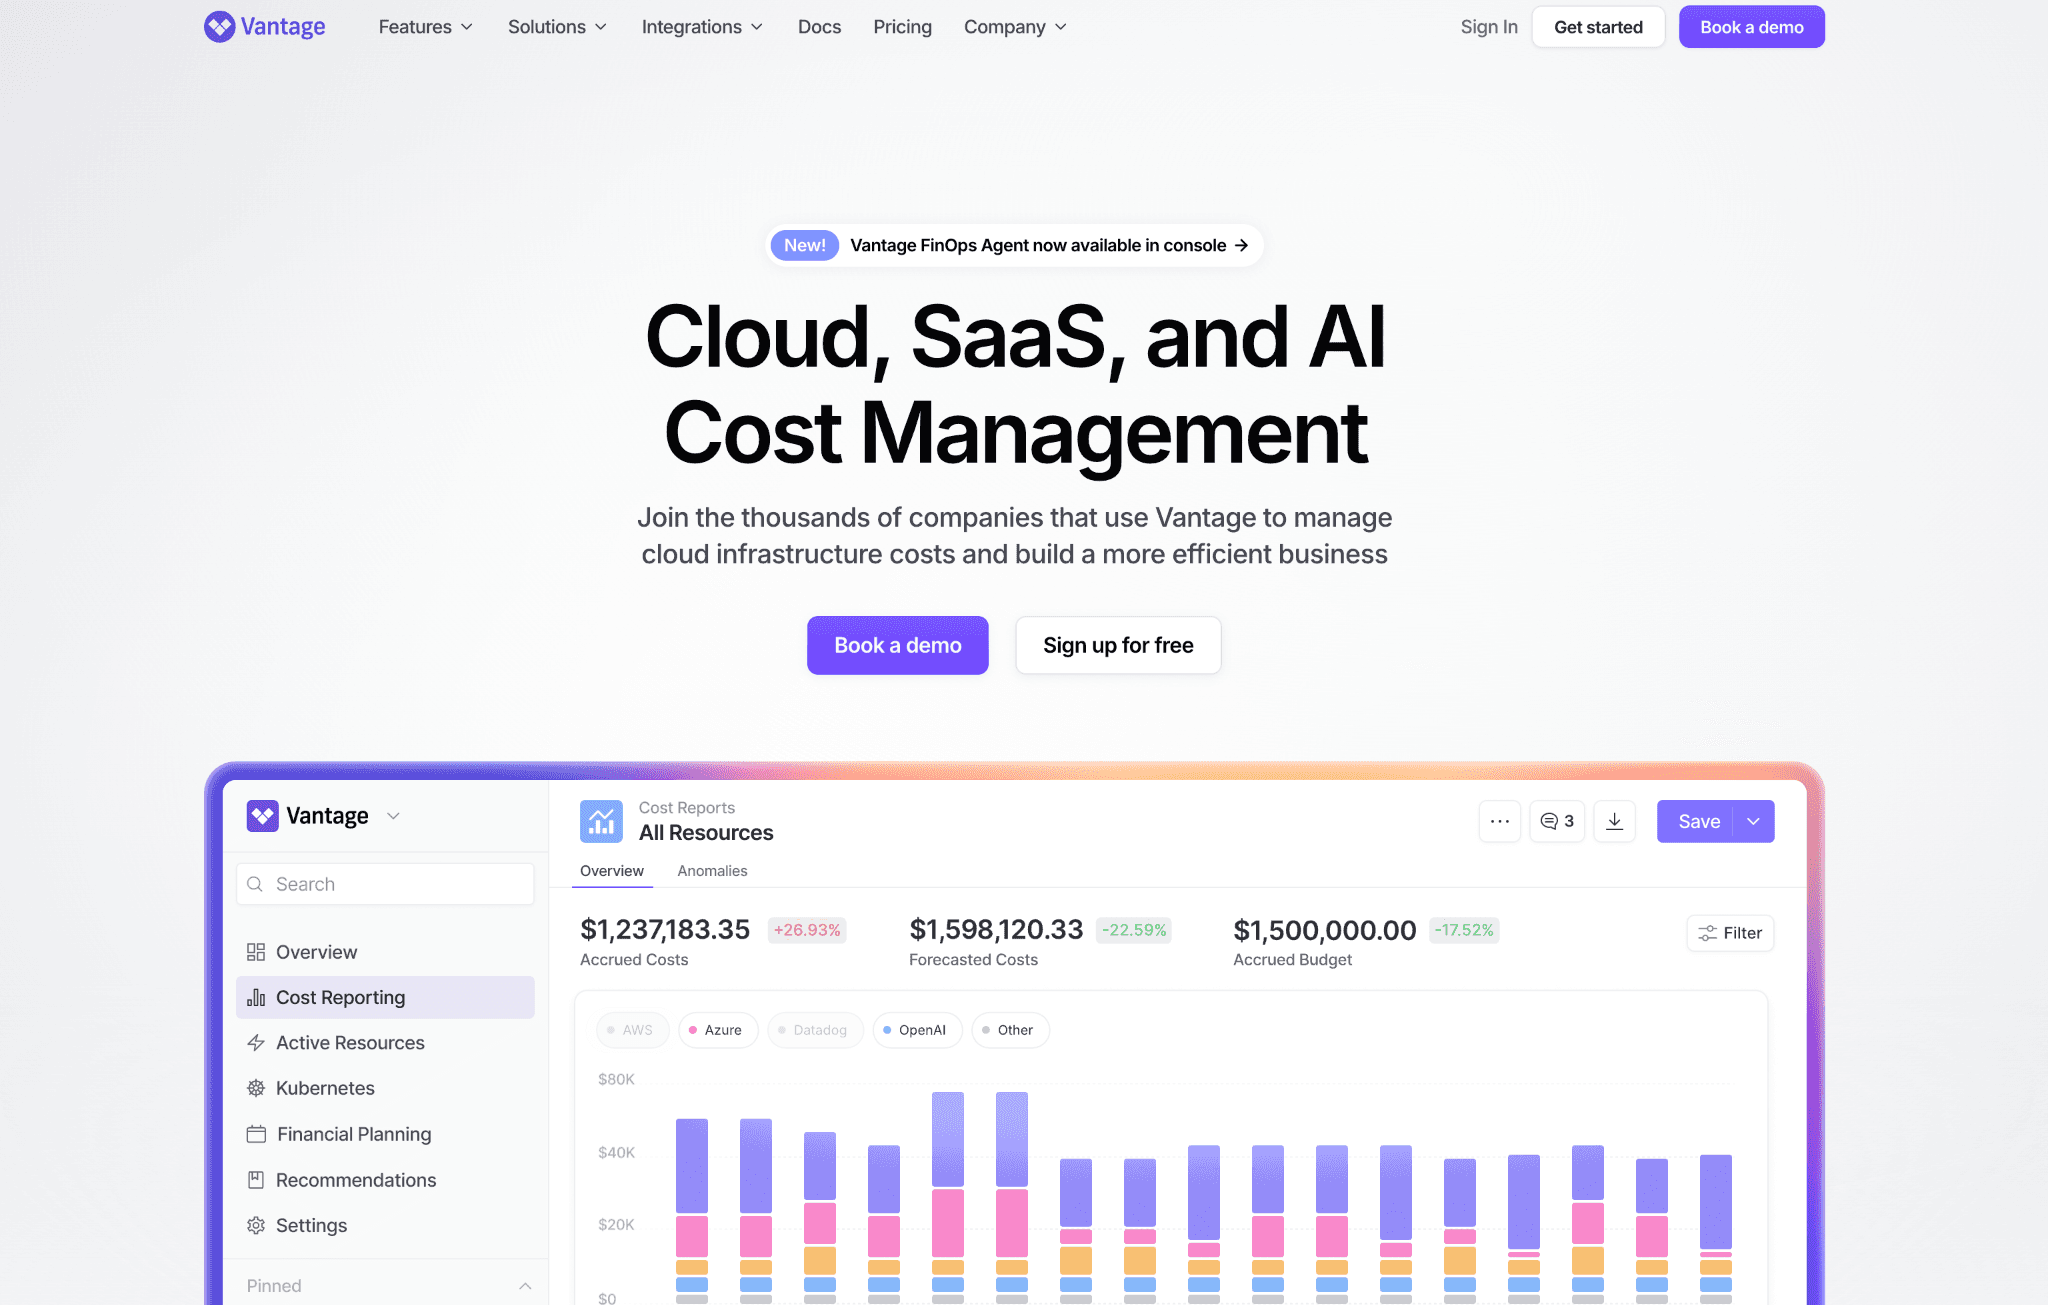
Vantage is a cloud cost visibility platform with fast self-serve onboarding and a clean multi-cloud dashboard. Its strongest differentiation is breadth of integration: 30+ providers, including AWS, Azure, GCP, and SaaS tools like Snowflake, Datadog, MongoDB Atlas, OpenAI, and Anthropic in a normalized cost view. The free Starter plan covers up to $2,500 of tracked cloud spend with no time limit.
Key features specific to cloud cost visibility:
Multi-cloud cost reports across AWS, Azure, and GCP with 30+ integrations that normalize cloud and SaaS spend into one view, so teams see total infrastructure cost rather than isolated cloud provider bills.
Network cost visibility via dedicated Network Cost Reports that surface inter-AZ traffic, NAT Gateway fees, and cross-region data transfer separately from compute costs, helping identify the data transfer patterns that inflate bills without being visible in native tools.
AI and SaaS cost visibility with direct integrations for OpenAI, Anthropic, Snowflake, and MongoDB Atlas, so teams see AI token costs alongside their cloud bill without building custom connectors.
Virtual Tagging to fix inconsistent native tags across teams and services and ensure full spend attribution.
Anomaly Detection with custom alerts sent via Slack, Microsoft Teams, email, and Jira.
Kubernetes cost visibility with Kubernetes Rightsizing and asset inventory across accounts.
Autopilot for AWS Savings Plans that handles commitment purchases automatically.
MCP server for querying cost data in natural language via ChatGPT or Claude.
Pricing:
Starter is free with no expiry, covering up to $2,500 of cloud spend with 3 users and 6 months of data history. Pro is $30 per month ($7,500 spend cap, 5 users), Business is $200 per month ($20,000 spend cap, 10 users), and Enterprise is custom with unlimited tracked spend, unlimited users, and an Automated FinOps Agent. Paid tiers offer a 14-day trial.
Pros (sourced from G2 verified reviews, PeerSpot, and AWS Marketplace reviews):
Users reported reducing cloud costs by approximately 50% and gaining clear understanding of cost distribution after implementing Vantage (PeerSpot verified review).
The free Starter tier with no time limit is rare in this category and lets small teams get genuine, long-term value without a sales process.
30+ SaaS integrations, including OpenAI and Anthropic, make it the strongest self-serve option for teams wanting total infrastructure cost in one view.
The MCP server that connects cost data to ChatGPT and Claude is the most accessible AI cost querying implementation for teams without a dedicated FinOps analyst.
Cons (sourced from G2, PeerSpot verified reviews):
Custom reporting is limited; users on G2 and PeerSpot noted advanced customization options need improvement, particularly for network flow reports and custom dashboard configurations.
Storage cost visibility stops at the bucket and account level; operation-type breakdowns (PUT vs. GET vs. LIST at different storage class rates) are not surfaced, which means lifecycle policy gaps remain invisible.
Native AI spend reporting beyond basic integrations needs development; teams doing deep per-model inference cost analysis will hit the ceiling quickly (G2 verified feedback).
The spend cap per pricing tier means fast-growing teams outgrow the Business plan in a single quarter of rapid growth and move to enterprise pricing conversations earlier than expected.
API access costs are an additional concern flagged by users managing programmatic cost workflows (PeerSpot verified review).
3. CloudZero
Best for: SaaS engineering leaders who need cloud cost visibility mapped to product features, customers, and deployments using code-driven allocation, not manual tagging, with anomaly detection that compares spend against 12 months of hourly history.
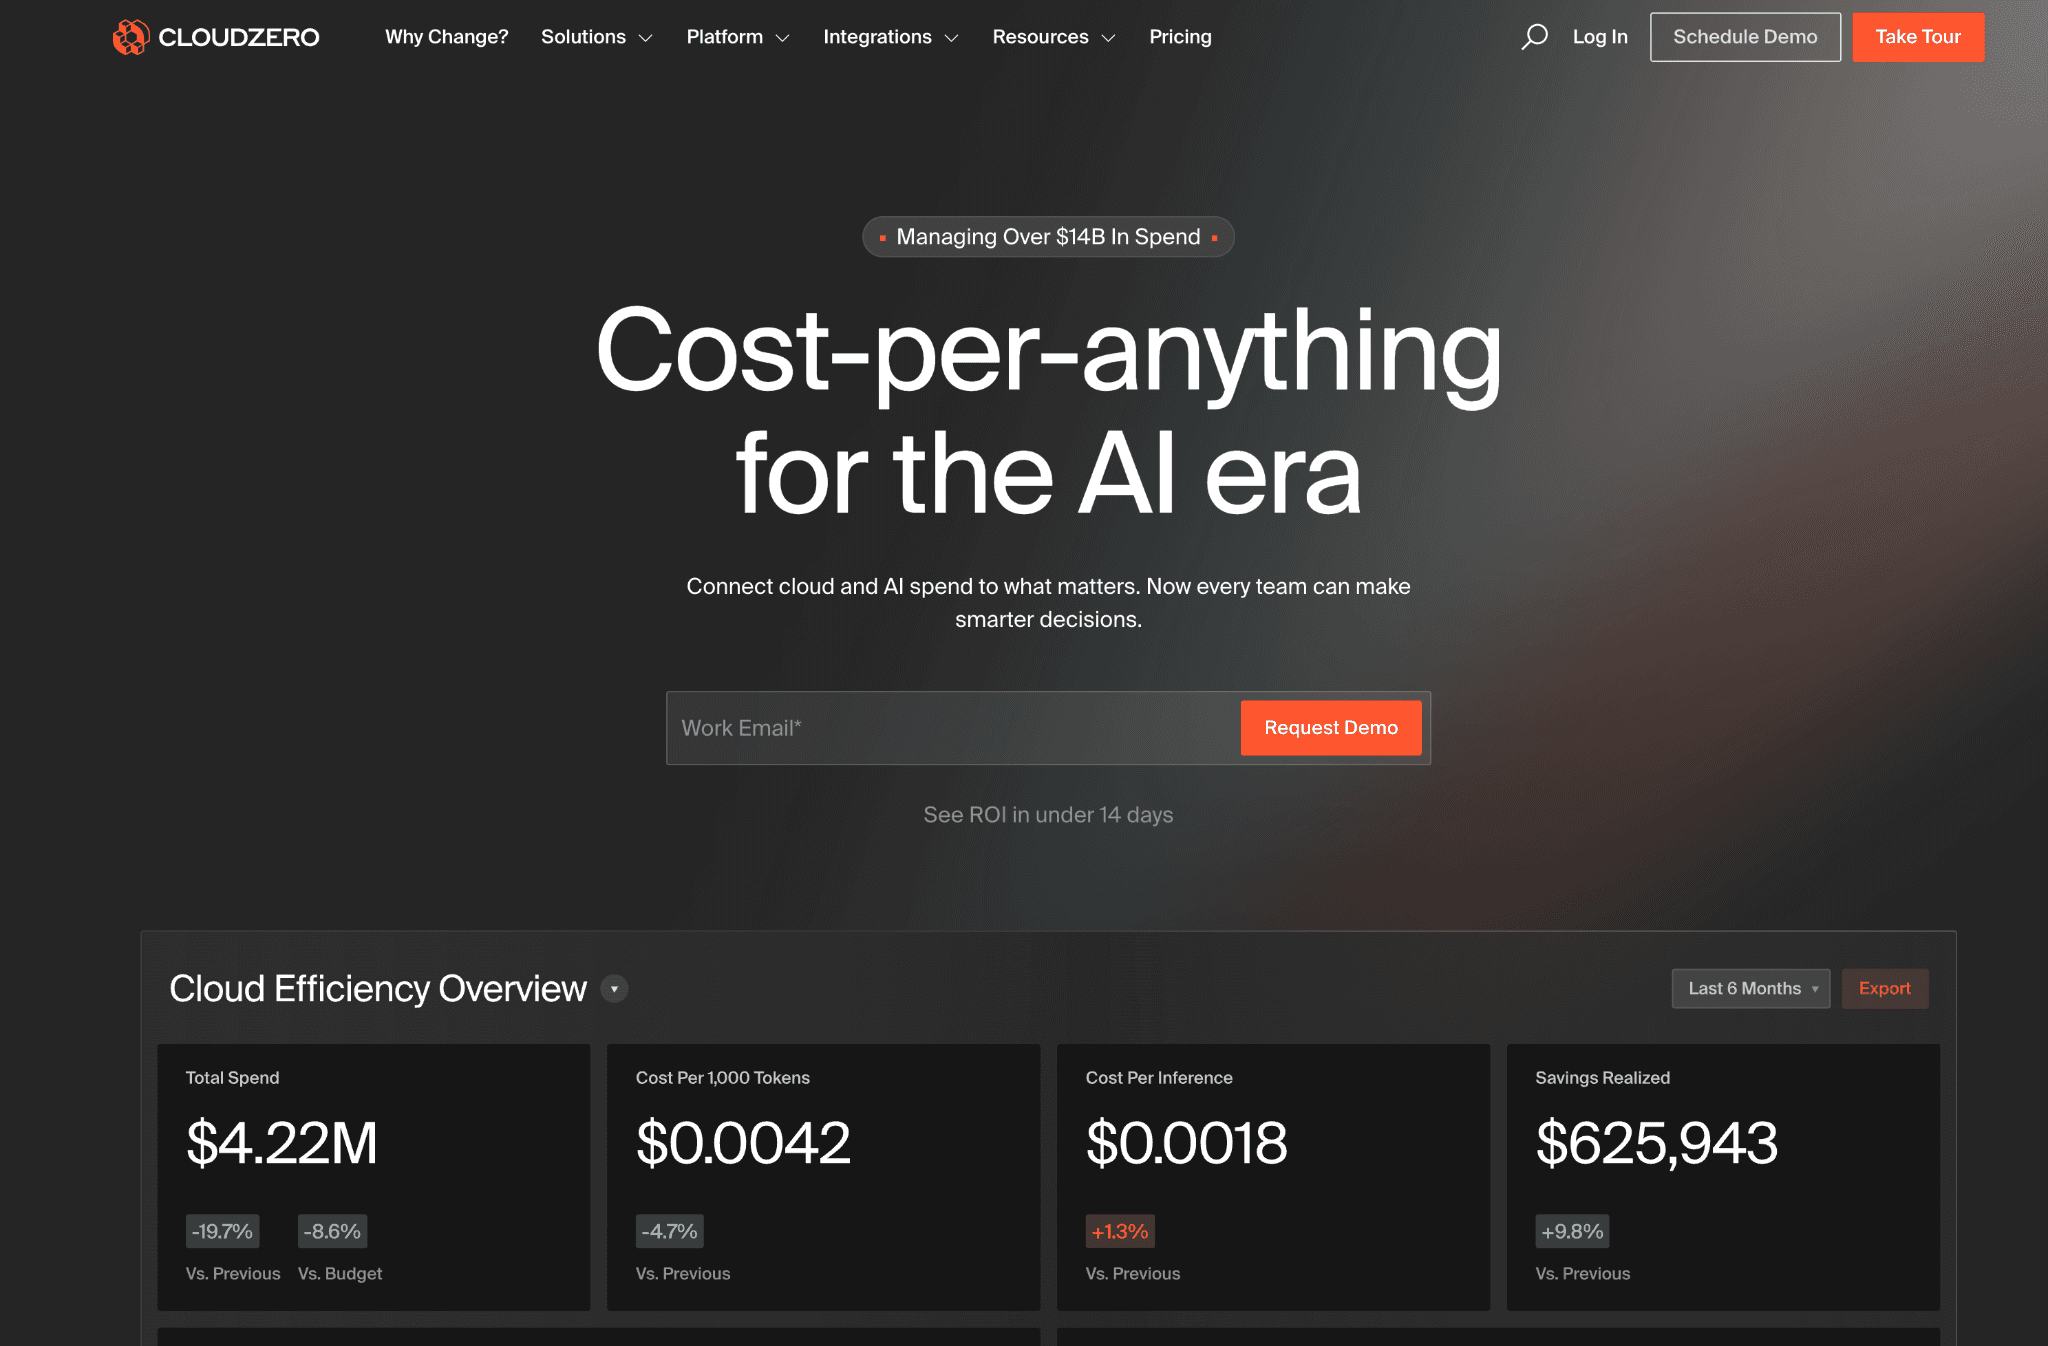
CloudZero is a cloud cost visibility platform built around unit economics. Its CostFormation engine lets teams define cost dimensions in code rather than in tag configuration, which means the allocation logic survives service renames and infrastructure refactors. The AnyCost API ingests spend from 50+ cloud, data, and AI providers into a single normalized model.
Key features specific to cloud cost visibility:
CostFormation allocation engine that defines cost dimensions in code, so spend maps to product features, customers, and deployments without depending on complete or accurate native cloud tags.
Anomaly Detection that compares hourly spend from the past 36 hours against hourly data from the prior 12 months, surfacing unusual cost patterns before they become a monthly billing problem.
AI Hub inside agentic tools like Claude Code, so engineers can query cost visibility where they already work without switching to a separate FinOps dashboard.
AnyCost API that ingests non-cloud SaaS spend from Snowflake, Databricks, and other providers, so product feature cost visibility includes every infrastructure layer.
Unit economics calculations for cost per customer, cost per feature, cost per team, and cost per transaction, mapped to the business metrics each stakeholder cares about.
Multi-cloud Kubernetes visibility at the namespace and workload level across 50+ providers.
Custom Dimensions for organizing costs by any business structure outside of the default cloud taxonomy.
Pricing:
CloudZero is sold exclusively through enterprise annual contracts with no public rate card and no self-serve access. Pricing is tied to cloud spend under management. There is no free trial; most engagements go through a formal sales and scoping process.
Pros (sourced from Gartner Peer Insights and TrustRadius verified reviews):
CostFormation's code-driven allocation is uniquely suited to SaaS companies that have already mapped product architecture to services, since it encodes that mapping rather than requiring a quarterly tag audit (Gartner Peer Insights).
Quality of support rated 9.9 on G2, with reviewers consistently noting the responsiveness and helpfulness of the CloudZero team (G2 metrics).
AI Hub inside Claude Code is a forward-looking visibility integration that no other platform on this list currently offers for agentic developer tooling.
Cons (sourced from TrustRadius, Gartner Peer Insights, and PeerSpot verified reviews):
The user interface is described as unintuitive and slow by several TrustRadius reviewers, with some pages being slow to load when filtering large cost datasets (TrustRadius verified review).
Alert configuration is inflexible; reviewers specifically noted that only one channel and email is allowed per alert, with no support for custom alert criteria (TrustRadius verified review).
Updating business cost mappings requires editing and pushing a YAML configuration file that can run thousands of lines; there is no UI-based method to make allocation changes (PeerSpot verified review).
The RBAC and permission model is admin-heavy, meaning viewers cannot create budgets or save custom views even with read access, a limitation described by Gartner reviewers as a significant day-to-day friction point.
Kubernetes telemetry agent is rated as average by Gartner users, with poor configuration surface and limited API coverage compared to dedicated Kubernetes cost tools (Gartner Peer Insights).
No free tier or self-serve trial rules it out for teams under $500K cloud spend who cannot justify an enterprise sales cycle before evaluation.
4. Apptio Cloudability
Best for: Large enterprises with a dedicated FinOps practice that runs monthly business reviews, needs audit-ready chargeback and showback reports across AWS, Azure, and GCP, and manages a large reserved instance and savings plan portfolio.
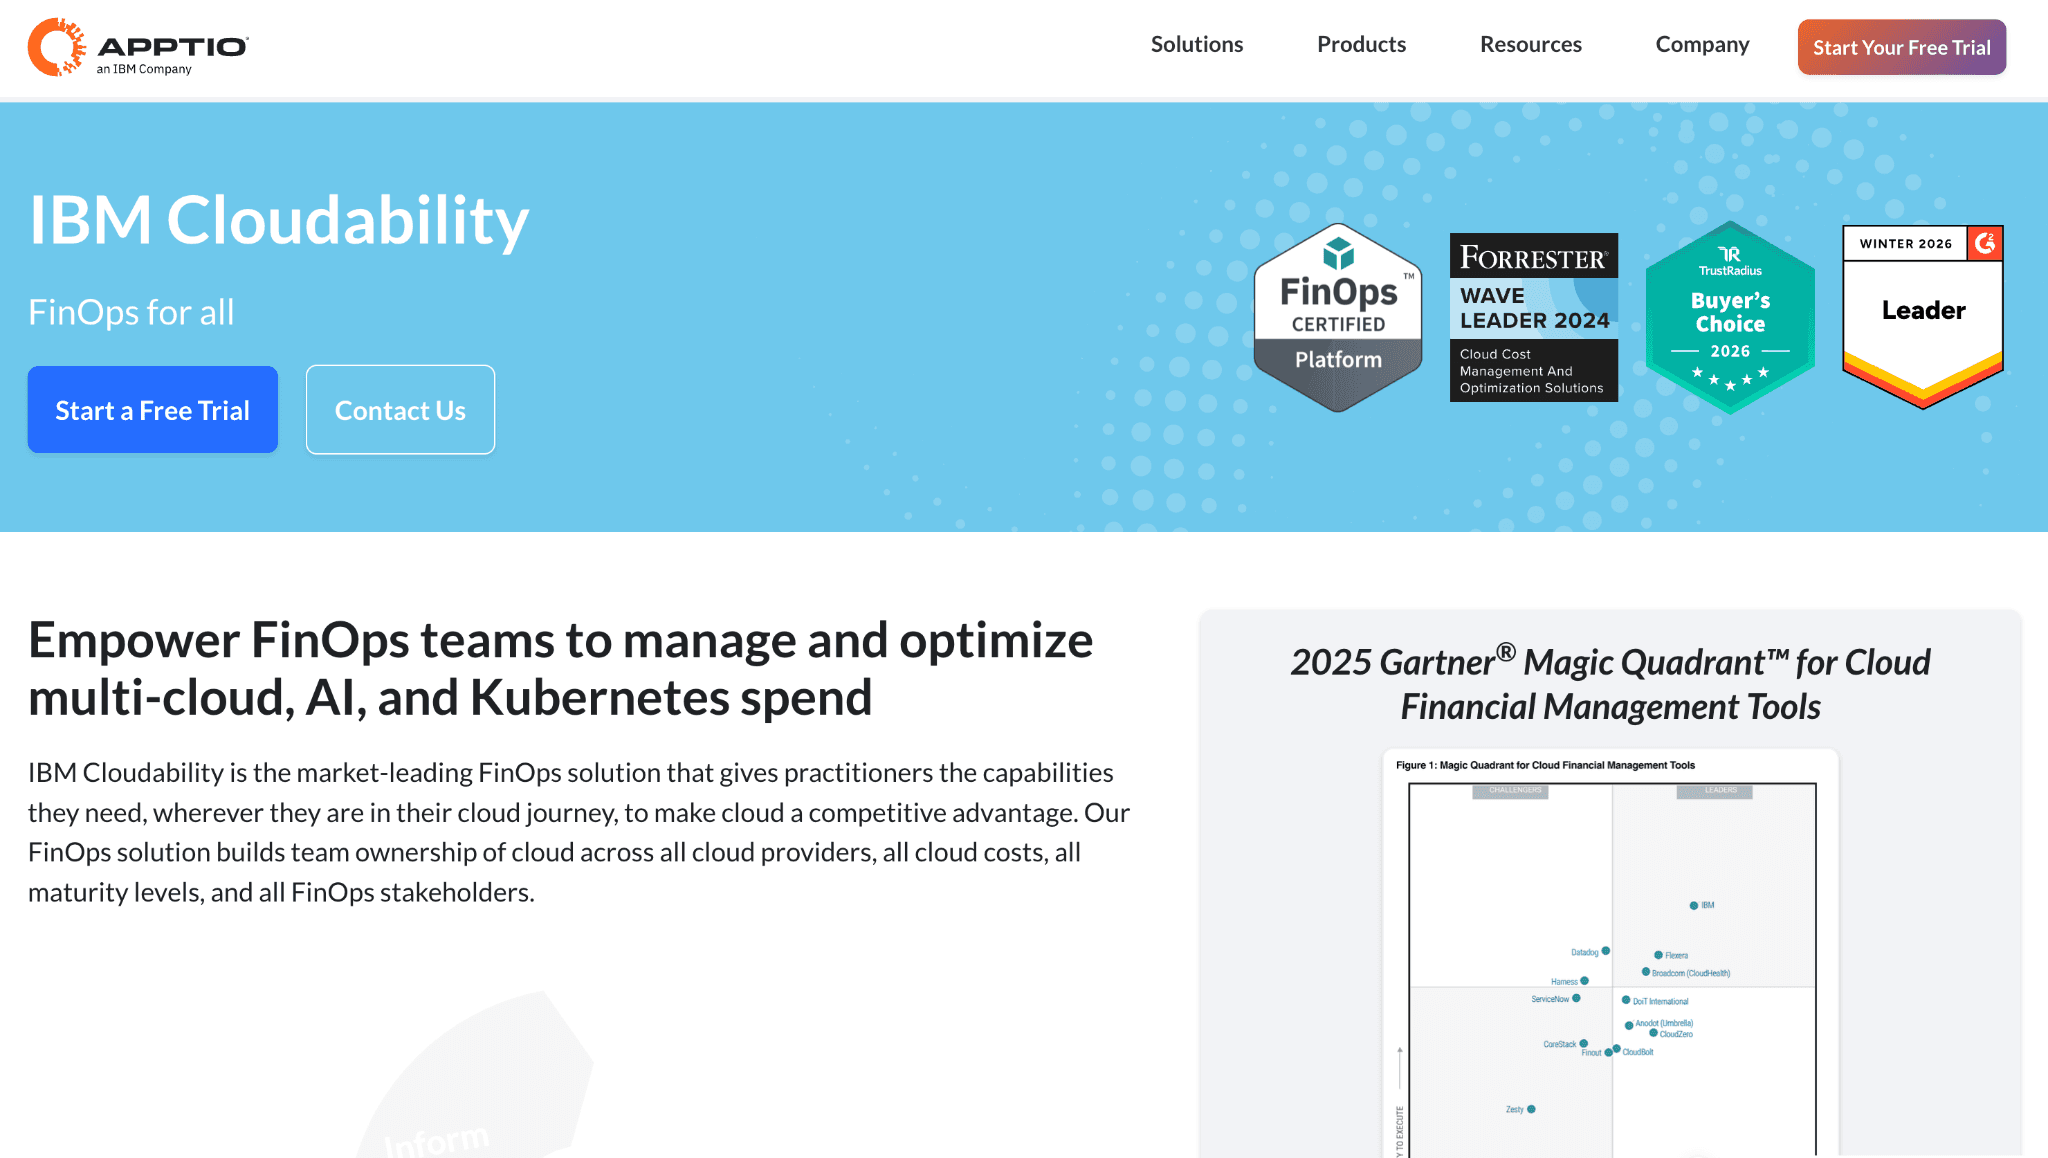
Apptio Cloudability, now part of IBM, is one of the most established cloud cost visibility platforms for enterprise FinOps. It handles multi-cloud cost visibility, container cost, chargeback reporting, and commitment program management across three tiers (Essentials, Standard, Premium) positioned around FinOps maturity.
Key features specific to cloud cost visibility:
Multi-cloud cost visibility across AWS, Azure, and GCP with container and AI cost tracking in a single normalized view.
Finance-grade chargeback and showback reporting with policy-based allocation rules designed to hold up under audit, so finance can close the monthly books without chasing engineers for usage data.
Commitment program automation that handles reserved instance and savings plan purchase, exchange, and expiry across all three major cloud providers.
Anomaly detection and waste reduction with real-time monitoring and automated alerting on cost deviations.
Unit economics and customer profitability analysis for FinOps teams that need to tie cloud cost to revenue-generating customers.
Forecasting and budgeting at the organizational unit and business line level.
Mature BI integrations that push cost data to Tableau, Power BI, and other enterprise reporting tools on a schedule.
Pricing:
Sold through IBM enterprise agreements with Essentials, Standard, and Premium tiers. No public rate card, no self-serve option, and no free trial. Most deployments include IBM professional services, which extend the total cost of adoption beyond the license fee and the time to first usable visibility by several weeks.
Pros (sourced from Gartner Peer Insights and TrustRadius verified reviews, where IBM Cloudability holds the 2025 TrustRadius Buyer's Choice Award with 546 verified reviews):
One of the most tenured enterprise FinOps platforms in the market, giving it credibility with CFOs and procurement teams who require a proven vendor with a multi-year track record (Gartner Peer Insights).
Chargeback and showback reporting depth is among the strongest available for enterprises that need documented, policy-driven allocation that holds under finance audit (TrustRadius verified reviews).
Supports both cloud cost and SaaS license cost visibility through the broader Apptio family, which suits enterprises consolidating IT financial management under one vendor.
Cons (sourced from G2, Gartner Peer Insights, and TrustRadius verified reviews):
Standard report views are hard-capped at 10 columns, a limitation documented on G2 where an enhancement request to expand to 20 columns has remained unaddressed; finance teams running wide chargeback reports will hit this ceiling on day one (G2 verified review).
There is no ability to automate the export of Cloudability reports, which forces FinOps analysts to run manual exports each reporting cycle and rebuilds the bottleneck the tool was meant to remove (G2 verified review).
The IAM and Groups access control feature released in 2025 cannot be applied across the entire product, leaving gaps in role-based access that enterprise security teams flag during deployment (G2 verified review).
Support tickets for basic requests average 3 to 5 days, and complex requests can take two weeks or more, which slows cost visibility iteration for teams that need quick answers (Gartner Peer Insights verified review).
Interface complexity is overwhelming for users unfamiliar with IT finance concepts; the platform requires significant training before non-FinOps stakeholders like engineering managers can navigate it independently (Gartner Peer Insights).
Deployment typically takes 6 to 12 weeks and requires IBM professional services in most cases, which delays first useful cost visibility and adds implementation cost on top of the license.
5. Datadog Cloud Cost Management
Best for: SRE and observability teams already paying for Datadog who want cloud cost visibility in the same dashboard as APM traces, logs, and infrastructure metrics, so a cost spike can be traced to a specific deployment or service change without switching tools.
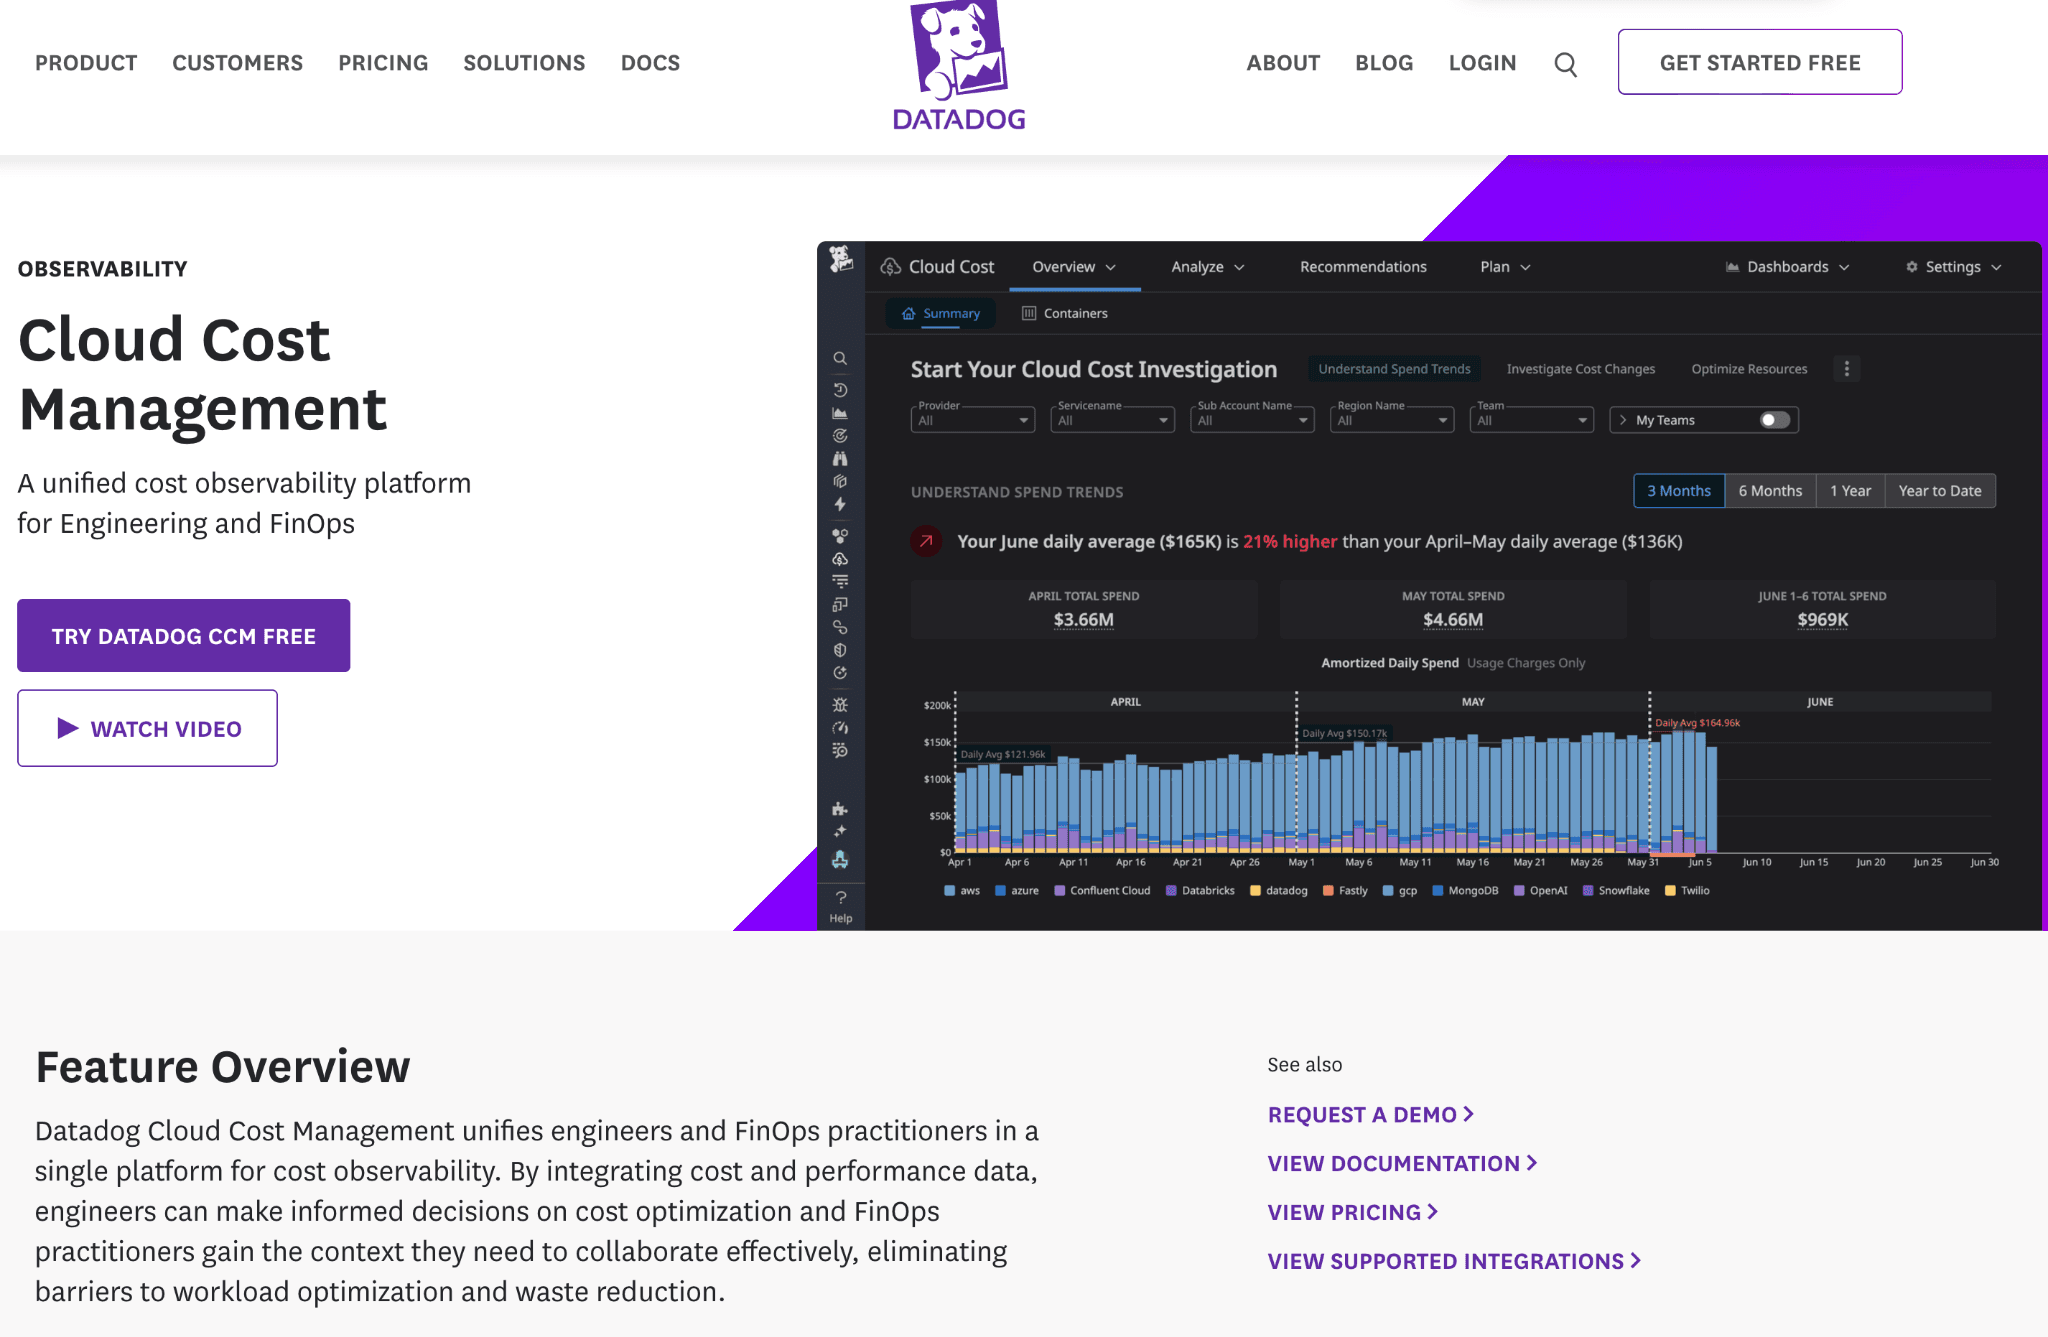
Datadog Cloud Cost Management is an add-on to the Datadog observability platform. It surfaces AWS, Azure, GCP, OCI, and SaaS cost data inside Datadog's existing dashboard and monitor framework. For teams that already operate on Datadog, the cost visibility layer activates without new tooling or separate logins.
Key features specific to cloud cost visibility:
Multi-cloud cost views across AWS, Azure, Google Cloud, OCI, and SaaS inside Software Catalog, Resource Catalog, and Container Monitoring dashboards.
Tag Pipelines and Custom Allocation Rules that distribute shared infrastructure costs using the tag hierarchy already defined for monitoring, so teams do not build a separate cost attribution strategy from scratch.
Cost and APM correlation that joins billing data with latency, error rate, and log events in one dashboard, allowing SREs to trace a cost spike to the specific deployment or traffic event that caused it.
Anomaly detection on cost metrics using Datadog's statistical anomaly engine, which surfaces budget deviations in the same alert channels as performance incidents.
Container cost visibility for Kubernetes workloads within existing Container Monitoring dashboards.
Budget alerts routed through existing Datadog monitor channels, so cost alerts and performance alerts share the same incident response workflow
Pricing:
Billed as an add-on to an existing Datadog subscription, priced by the number of cloud accounts monitored. Exact per-account pricing is not publicly disclosed. Teams already on Datadog activate it with minimal friction; teams not yet on Datadog pay for the core platform plus the CCM add-on, which typically makes it the most expensive option per cost visibility feature on this list.
Pros (sourced from Gartner Peer Insights, SelectHub verified reviews, and Capterra):
Cost data in the same dashboard as performance and reliability metrics removes the context switch that every standalone cost visibility tool requires, which is uniquely valuable for SREs who need to correlate a cost spike with an infrastructure change (Gartner Peer Insights, SelectHub).
Tag Pipelines reuse the tagging structure already defined for monitoring, so there is no separate cost tagging design exercise for teams that have already built mature Datadog tag hierarchies (Datadog product documentation).
Custom cost dashboards are built with the same widget framework as existing operational dashboards, which means there is no new training for SREs who already use Datadog day-to-day (SelectHub verified review).
Cons (sourced from Gartner Peer Insights, SelectHub, SigNoz analysis of verified Datadog billing data, and Capterra):
Datadog's host-based pricing creates a specific risk in containerized environments: misconfiguring the agent to run in every container or pod bills each pod as a separate host; on a 50-node cluster running hundreds of pods, a single misconfiguration can increase the total Datadog bill by 10x or more (SigNoz analysis based on verified billing data).
Custom metrics and all metrics sent via OpenTelemetry are billed as custom metrics in Datadog, which at scale can represent up to 52% of total billing, making the combined cost of Datadog plus CCM significantly higher than purpose-built cost visibility platforms (SigNoz verified billing analysis).
The platform surfaces where cost occurs but does not provide specific rightsizing actions; teams need a second platform or a manual review cycle to act on what they see, making it a visibility-only layer without a recommendations engine (Gartner Peer Insights, SelectHub).
There is no unit economics modeling, no chargeback automation, and no shared infrastructure split logic, so finance teams and CFOs cannot make CCM their primary cloud cost platform (Datadog product documentation).
New users find it takes time to understand all cost features and how filters, tags, and dashboards work together; the learning curve is noted as steep without prior Datadog expertise (Gartner Peer Insights verified review).
6. Harness Cloud Cost Management
Best for: Engineering teams already standardized on Harness for CI/CD, feature flags, or pipelines who want cloud cost visibility embedded in the deployment workflow and idle non-production environment detection without onboarding a second vendor.
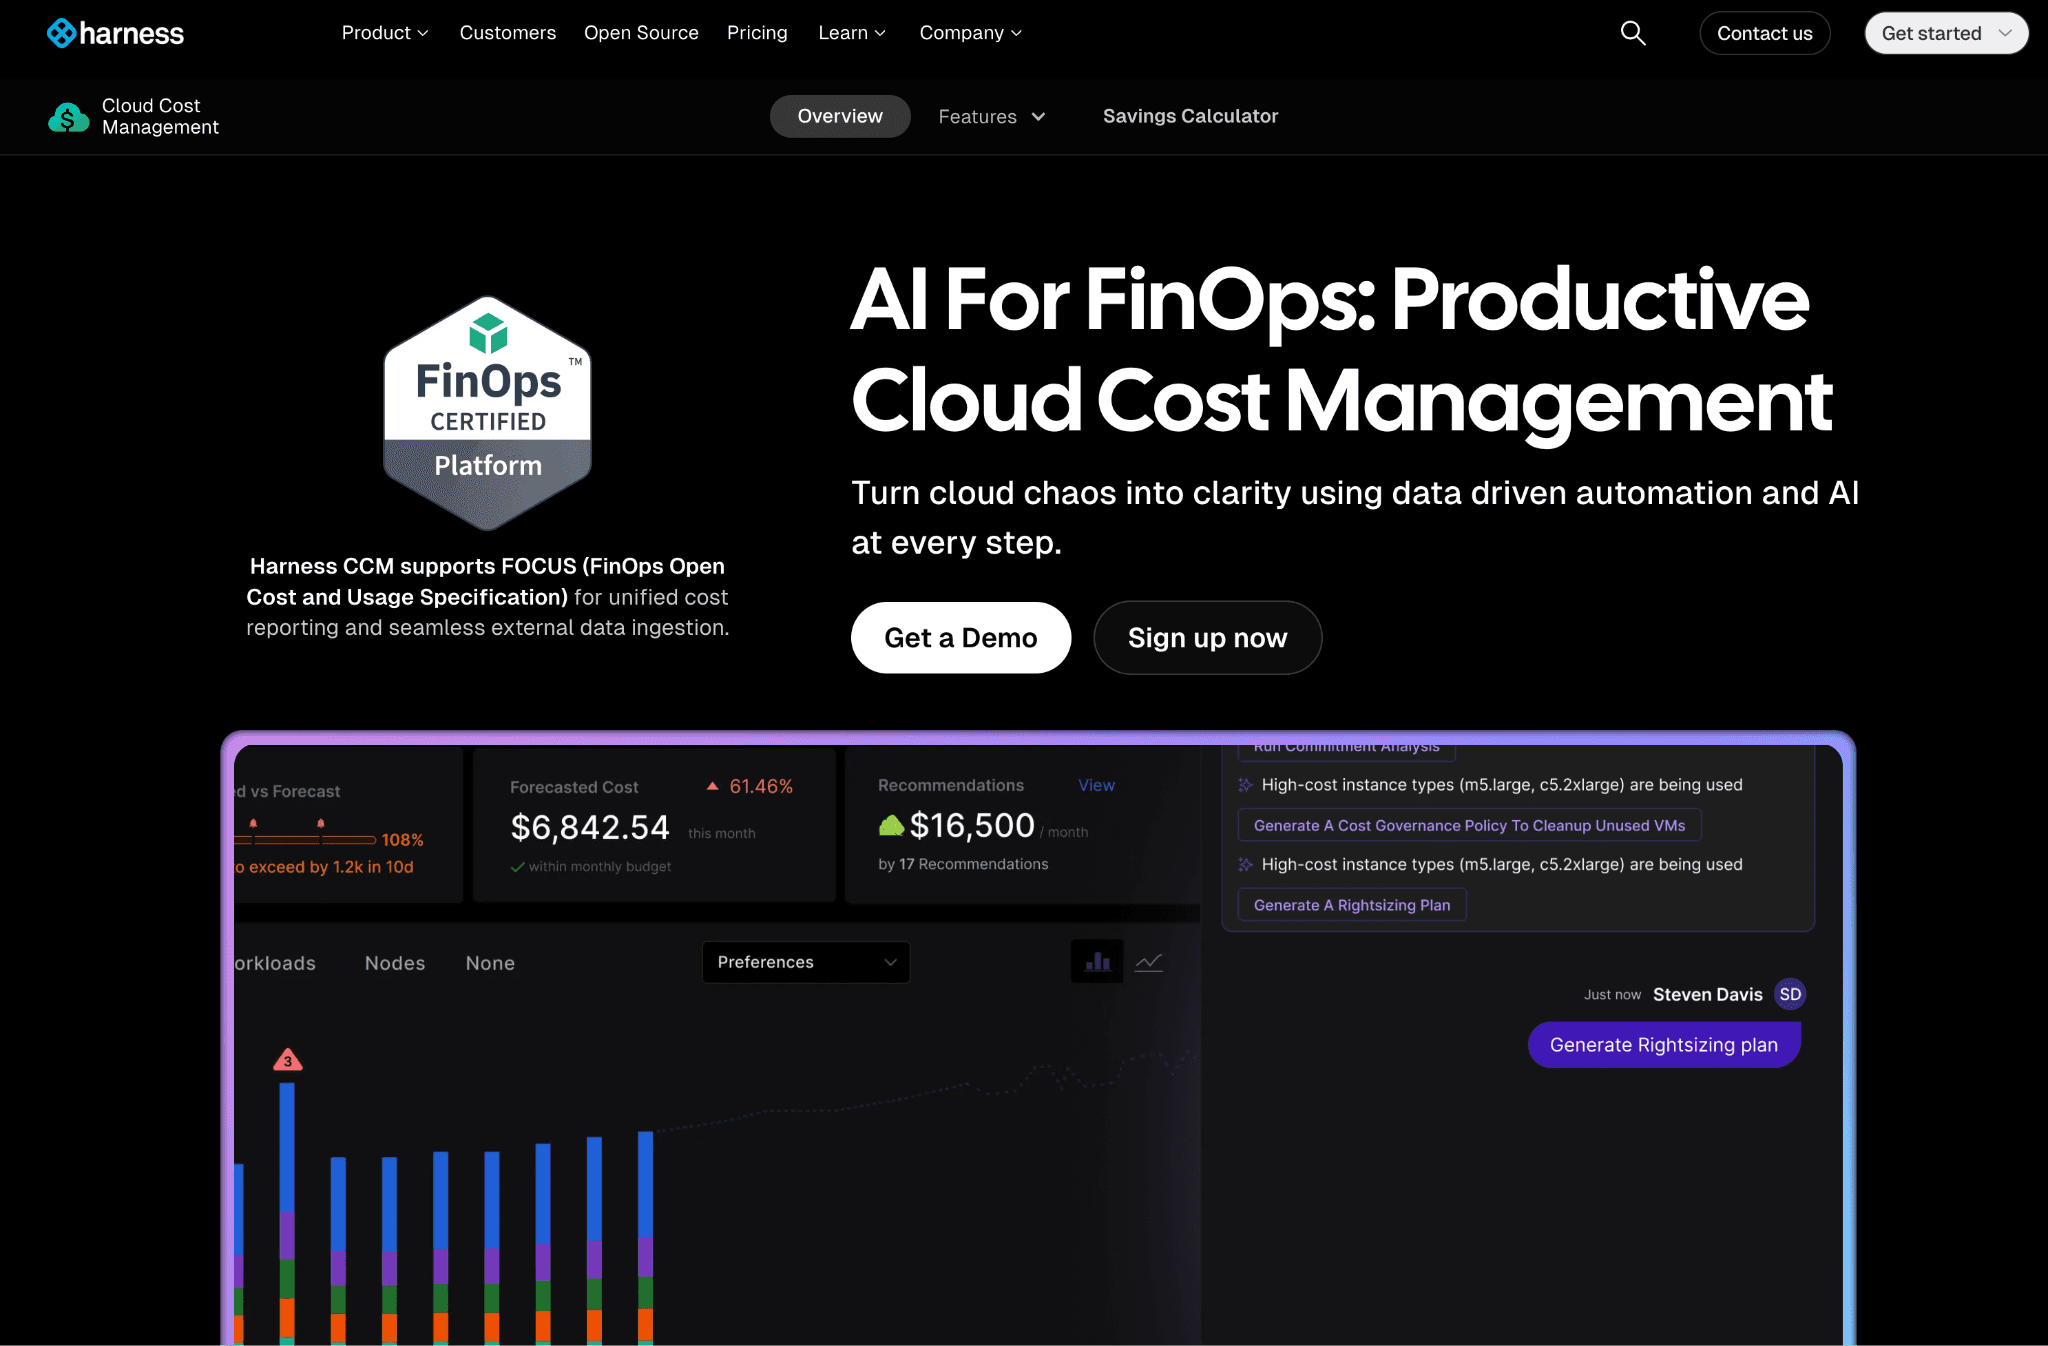
Harness Cloud Cost Management lives inside the Harness Software Delivery Platform. Engineers see cost impact next to pipeline runs, so a deployment that doubles a service cost shows up in the same view as its latency metrics. AutoStopping is the product's standout capability: it detects idle dev, staging, and QA environments using actual traffic signals and shuts them down, then restarts them on the next developer request.
Key features specific to cloud cost visibility:
Deployment-level cost visibility that links every cloud dollar to the specific pipeline run, feature flag, or deployment that caused it, so engineering teams see cost impact in the workflow where they ship code.
AutoStopping for non-production visibility and control that detects idle environments using traffic patterns, surfaces how much those idle environments cost, and stops them automatically, recovering up to 70% of non-production spend.
Kubernetes pod and namespace cost visibility via Cluster Orchestrator, with granular workload-level allocation including node autoscaling and spot orchestration decisions visible alongside cost.
Anomaly detection on cloud spending with intelligent alerting on cost spikes, routed to the engineer whose deployment caused the change.
AI recommendations that identify over-provisioned and idle resources, with rightsizing plans visible in the same view as the deployment that created them.
Recommendations for AWS, Azure, GCP, and Kubernetes, including VMs, ECS, EBS, and RDS, with estimated monthly savings attached.
Conversational FinOps for natural-language cost queries inside the Harness platform.
Pricing:
A free starter tier covers basic cost views and recommendations. Paid plans (Essentials and Enterprise) are available by contacting sales and are priced based on cloud spend volume. Teams buying CCM outside an existing Harness contract pay full platform pricing, which makes standalone CCM more expensive than dedicated cost visibility tools at the same capability level.
Pros (sourced from Gartner Peer Insights and AWS Marketplace verified reviews):
AutoStopping is genuinely unique on this list; no other platform in the group detects idle environments using live traffic signals, stops them, and restarts them on demand without any manual operations work (Gartner Peer Insights).
Granular cloud resource details help with cost savings in a practical, engineering-accessible way; reviewers specifically noted that the resource-level visibility drives actionable decisions (Gartner Peer Insights verified review).
Free starter tier means existing Harness customers activate cost visibility without a separate procurement cycle, which speeds time-to-value compared to enterprise-only platforms.
Cons (sourced from Gartner Peer Insights, SelectHub, and finout.io analysis of verified Harness reviews):
Connector setup is not fully implemented for large enterprise deployments; reviewers on Gartner note that some features in the connector configuration require workarounds that are not documented (Gartner Peer Insights verified review).
One enterprise reviewer on Gartner described the overall experience as significantly negative after implementing the VM stop-start functionality, reporting a financial loss from the engagement; the experience led to contract termination (Gartner Peer Insights verified review, publicly available).
Finance-grade reporting including chargeback, showback, and unit economics is underdeveloped compared to dedicated FinOps platforms, so CFOs and finance directors will not find the depth they need for monthly business reviews (Harness product documentation, finout.io verified review analysis).
Cloud pricing calculator module has inaccuracies flagged by users; reviewers noted the cost estimates in the module can diverge from actual billing (Gartner Peer Insights).
Teams not already on Harness pay full platform pricing to access CCM, which is difficult to justify when dedicated cost visibility tools offer more depth at a lower total cost (Harness pricing page).
7. nOps
Best for: AWS-first SaaS and AI engineering teams running Kubernetes-heavy workloads who need container-level cost visibility matched to the CUR file at the pod level, combined with automated commitment management on a savings-share pricing model.
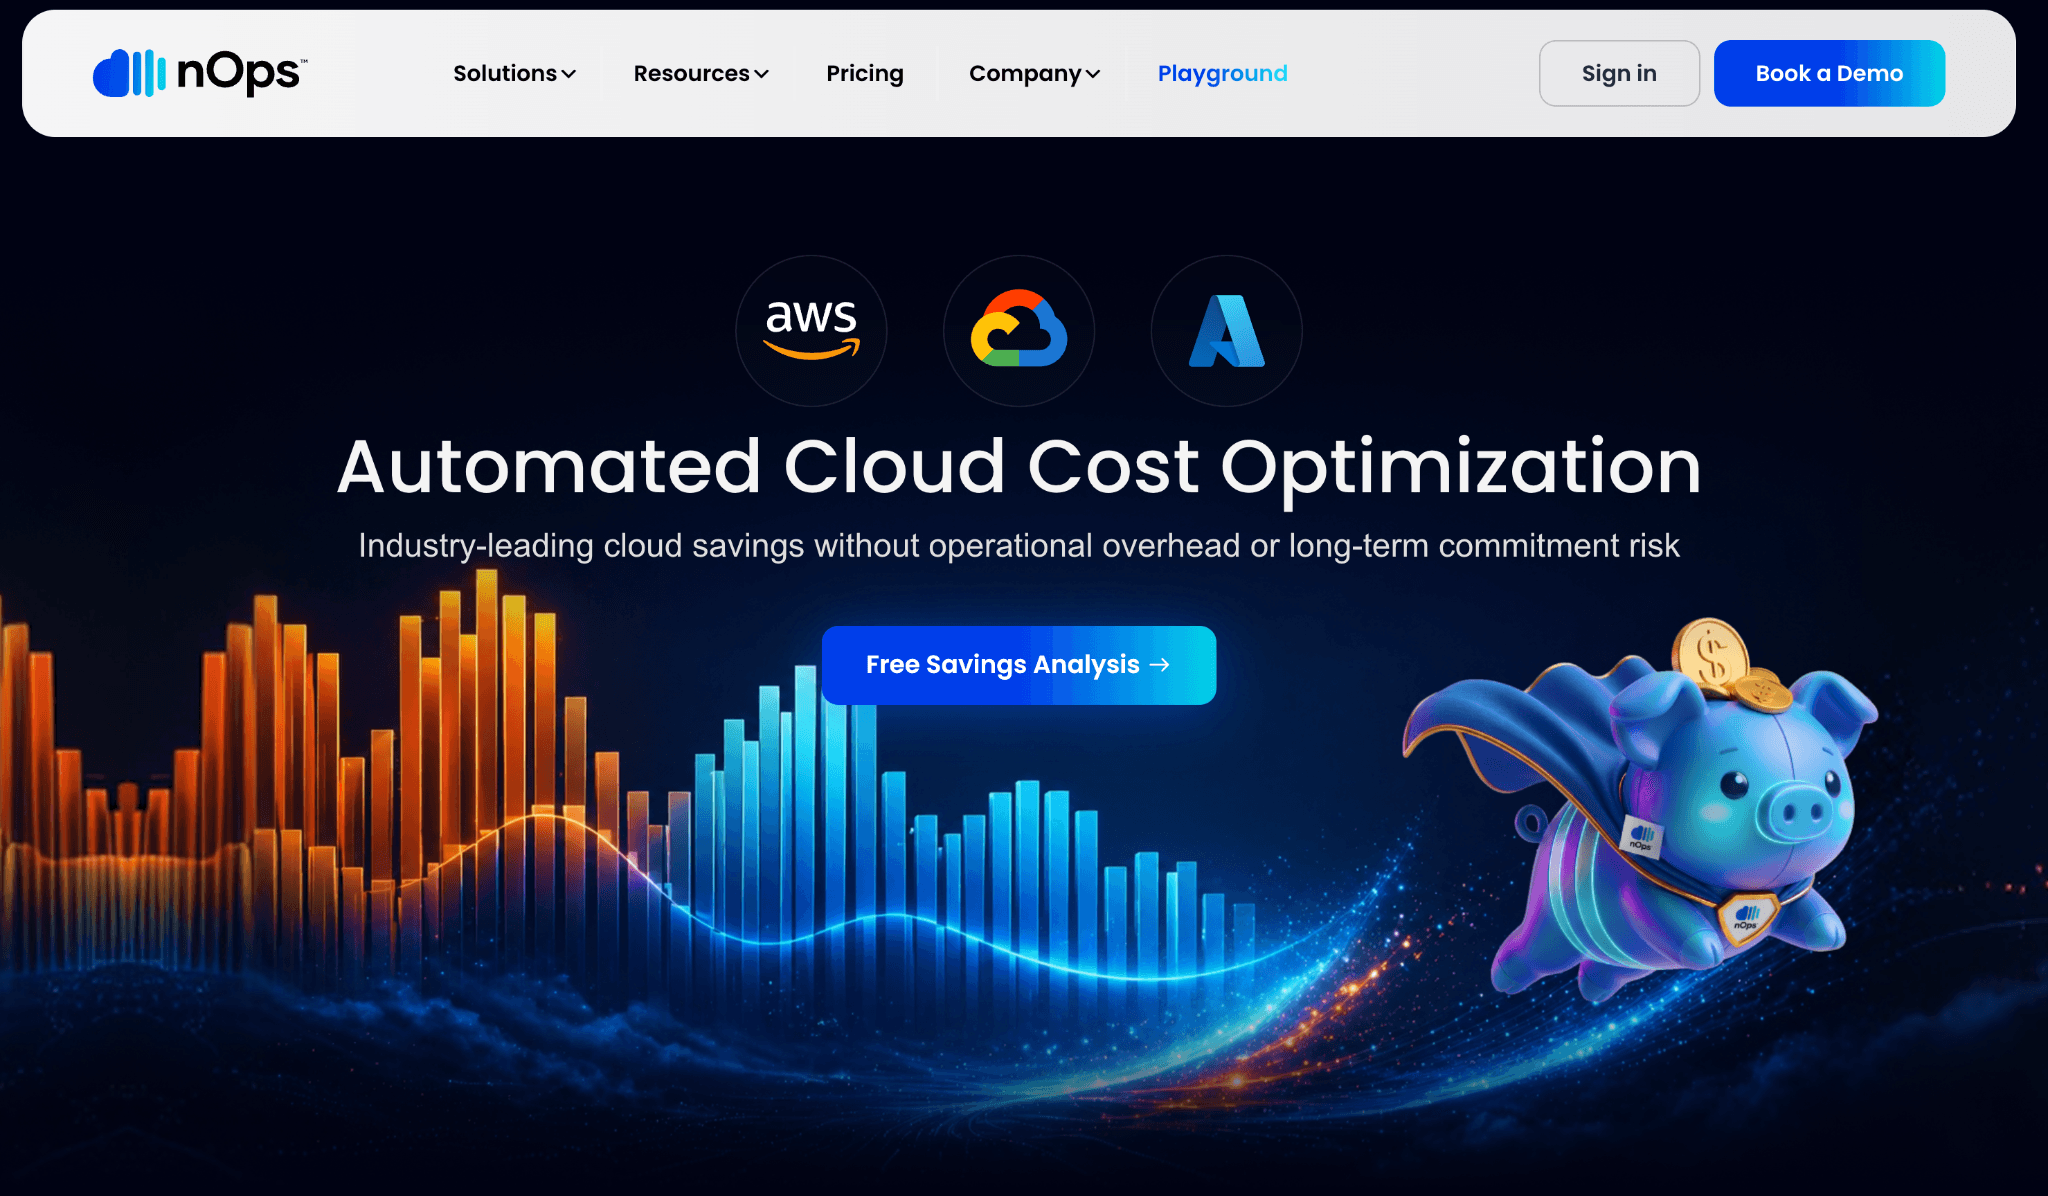
nOps is a cloud cost visibility platform built for engineering-led teams where AWS is the primary cloud and Kubernetes is central to the workload. The product provides hourly multi-cloud cost views with Kubernetes allocation that is 100% matched to the AWS Cost and Usage Report at the pod level, which closes the gap between cloud billing and container cost attribution.
Key features specific to cloud cost visibility:
Kubernetes container-level cost visibility matched 100% to the CUR file at the pod level, giving platform teams a container attribution view that is reconciled directly against the AWS billing record.
Hourly multi-cloud cost visibility across AWS, Azure, GCP, Kubernetes, GenAI, and SaaS in a unified view, with anomaly detection surfacing cost spikes in real time.
GenAI cost visibility that tracks AI workload spend across supported providers in the same dashboard as cloud infrastructure costs.
Commitment coverage visibility for AWS, Azure, and GCP, with automated management of reserved instances and savings plan purchase and exchange.
Clara, AI FinOps Analyst that answers natural-language questions about cost and usage with context-aware insights, so engineering teams query spend without writing filters or SQL.
Real-time anomaly detection with root cause analysis on cost spikes, attributed to the service or team generating the change.
FinOps for AI comparison point: nOps covers GenAI cost visibility at a summary level; teams needing per-model inference token breakdowns should evaluate platform depth during trial.
Pricing:
Cost Visibility and Allocation uses a fixed fee based on cloud spend volume, with a 14-day free trial covering all core visibility, allocation, and reporting features. The Autonomous Rate Optimization product uses a savings-share model with no upfront fee; charges apply only when savings are realized.
Pros (sourced from Capterra verified reviews, G2, and AWS Marketplace):
Full visibility into AWS resources with detailed workload consumption data and highlighted savings opportunities, backed by the platform's 100% commitment utilization guarantee, where it provides credits for unused reserved instances it recommended (Capterra verified review).
Compute Copilot for Auto Scaling Groups delivered measurable savings on AWS ECS clusters, with reviewers citing this as a standout feature for compute cost visibility (Capterra verified review).
Savings-share model on rate optimization means no charges until savings are delivered, which aligns vendor incentives with customer outcomes and simplifies internal procurement justification.
A 14-day free trial gives engineering teams full access to core visibility before committing to a contract, which is a differentiator compared to enterprise-only platforms.
Cons (sourced from Capterra verified reviews, G2, and Gartner):
IAM role setup must be modified manually for each account in multi-account AWS environments; reviewers described this as cumbersome and time-consuming at scale (Capterra verified review).
Dashboard interface requires improvement; users noted that data representation is not sufficiently graphical and the visual layout needs work for quick cost visibility (Capterra verified review).
Advanced reporting features require an additional subscription beyond the base visibility product; teams that discover this after onboarding find the reporting capability feels limited without paying more (G2 verified review).
The platform occasionally misidentifies short-term traffic peaks as idle time in AutoStopping-style scenarios, which can result in false positive shutdowns that interrupt non-production workflows (Capterra verified review).
Inventory detail has regressed in recent versions, with users noting the depth of resource-level data has decreased compared to earlier versions of the platform (Capterra verified review).
Azure and GCP allocation depth is less mature than AWS, so multi-cloud teams looking for CUR-equivalent granularity on Azure or GCP billing will find the coverage uneven.
Common Mistakes When Buying Cloud Cost Visibility Software
Most teams regret their choice within 90 days because of evaluation errors, not product errors. These are the six mistakes that cause it.
1. Accepting "service-level" visibility as complete visibility. Knowing you spent $80,000 on EC2 and $40,000 on S3 is not visibility. Visibility is knowing which S3 storage class, which operation type, which team, and which application drove each dollar. If a demo only shows account and service aggregates, the tool is not giving you cost visibility, it is repackaging the native billing console.
2. Not testing network cost attribution. NAT Gateway charges contain a hidden per-GB data processing fee on top of the hourly rate. Cross-AZ data transfer at $0.01 per GB each way adds up silently. Ask every vendor to show you what inter-AZ and inter-region transfer cost looks like, attributed to the service generating it, not rolled into EC2 Other.
3. Skipping GPU and AI cost coverage. GPU node-hours at $2 to $8 per hour can become the largest line item on the bill in a single sprint. A platform that tracks GPU spend only at the instance-type level, without separating GPU memory utilization cost or per-model inference spend, leaves the fastest-growing cost line opaque.
4. Choosing write-access tools without security sign-off. Platforms that automate purchasing or scaling need write access. Many enterprise security teams will not approve it. Confirm before you run the proof of concept, not after you sign the contract.
5. Picking for the current scale, not the 18-month scale. A platform that handles a $300K cloud bill often breaks at $3M, because allocation rules, tag volumes, and cross-account complexity compound. Evaluate on your projected 18-month footprint.
6. Testing only the AWS connection. Many platforms have deep AWS coverage and thin Azure and GCP integration. Run the proof of concept on your top two cloud providers simultaneously.
How to Choose the Right Cloud Cost Visibility Platform
Write down the one cost question your team cannot currently answer in under 60 seconds. The right platform is the one that closes that gap in the first 30 days.
If the question is about storage tier waste (S3, Blob, GCS): Amnic provides operation-level and tier-level breakdown. Most other tools stop at bucket totals.
If the question is about network egress and NAT Gateway cost attribution: Amnic and Vantage both surface network cost reports beyond the account aggregate. Verify NAT per-GB granularity during the trial.
If the question is about GPU memory and AI inference cost: Amnic tracks Amazon Bedrock at the model and token level. Vantage integrates OpenAI and Anthropic billing. Most others treat AI cost as a summary line.
If the question is about cost per product feature or cost per customer: CloudZero's CostFormation is purpose-built for this use case. Amnic covers it through unit economics.
If the question is about enterprise chargeback and BI integration: Apptio Cloudability delivers finance-grade chargeback depth but requires a full IBM procurement cycle.
If the question is about cost visible in the CI/CD pipeline: Harness CCM surfaces cost next to deployments for teams already standardized on the Harness platform.
If the question is about Kubernetes container-level cost matched to AWS billing: nOps delivers 100% CUR-matched pod-level attribution. Amnic covers Kubernetes alongside the full multi-cloud footprint.
Why Teams Choose Amnic for Cloud Cost Visibility
Amnic is built for teams that are done with the FinOps specialist bottleneck. The platform answers the questions that block spend decisions: which storage lifecycle policy is missing, which GPU node is running at 12% memory utilization, which NAT Gateway is processing gigabytes for a workload no one recognizes.
Three things consistently come up in buyer evaluations:
Storage, network, and GPU visibility in one platform. Amnic breaks Amazon S3 storage costs down by class and operation type, surfaces NAT Gateway processing charges as a separate line from the hourly fee, and tracks GPU memory utilization cost on Kubernetes alongside Bedrock inference spent by model. These are the layers where clouds hide.
Read-only access with no infrastructure changes. Amnic never writes to your cloud. Security teams approve the deployment in days. DevOps owns every action taken on the back of an Amnic recommendation. This is why companies with mature security postures choose Amnic over write-access automation tools.
Any stakeholder gets the answer they need. X-Ray Agent benchmarks your cloud financial health in under 30 seconds. Insights Agent gives a CFO a business-language answer to "what drove our Bedrock spend up 40% this month" without requiring cloud taxonomy knowledge. Governance Agent catches tag hygiene gaps that leave spend unattributed. Reporting Agent builds a board-ready cost breakdown in seconds.
Frequently Asked Questions
What is cloud cost visibility software?
Cloud cost visibility software pulls billing and usage data from AWS, Azure, GCP, and other providers, then allocates it to teams, products, storage tiers, network paths, and resource IDs in a single dashboard. It answers what was spent, where, who owns it, and why it changed, in close to real time. Platforms that surface only account-level or service-level totals provide partial visibility; full visibility goes to the operation, tier, and GPU-hour level.
What is the difference between cloud cost visibility and cloud cost optimization?
Visibility is the see-and-attribute layer. You cannot optimize what you cannot see. Cloud cost management tools combine visibility as the foundation with optimization on top through rightsizing, anomaly detection, commitment management, and governance. Visibility tells you which S3 objects are in the wrong storage class; optimization makes the lifecycle rule that moves them.
How does AI improve cloud cost visibility?
AI does three specific things for cost visibility. First, anomaly detection models compare real-time spend against historical baselines to catch a spike in GPU memory costs or NAT Gateway charges within hours, not at month-end. Second, natural-language querying removes the FinOps analyst bottleneck so a CFO can ask "how much did we spend per Bedrock model last week" and get an attributed answer in seconds. Third, AI-driven forecasting on visibility data predicts spend at the service, storage class, and AI workload level before the billing cycle closes.
What are the best cloud cost visibility tools for MSPs?
For managed service providers running multiple client cloud environments, the best multi-cloud cost visibility tools are those that support multi-tenant allocation, per-customer chargeback, and white-label reporting. Amnic, Apptio Cloudability, and nOps are the strongest fits, as they support separate cost attribution per client account with allocation rules that do not require every client to use the same tagging convention.
Can cloud cost visibility software track storage cost by tier and operation type?
Most platforms surface storage cost at the bucket or service level. Amnic breaks S3 cost down by storage class (Standard, Infrequent Access, Glacier, Intelligent-Tiering) and by operation type (PUT, GET, LIST, SELECT, each priced differently per 1,000 requests), which is where undetected lifecycle policy gaps inflate bills. Before selecting a platform, test whether it can answer which operations on which buckets are generating the most cost.
How does cloud cost visibility software handle GPU and AI workload cost?
GPU cost visibility requires the platform to track node-hours at the GPU instance level, separate GPU memory utilization cost from CPU billing, and, for AI workloads, break down inference cost by model, by token type, and by request type. Amnic tracks Amazon Bedrock at this level with OpenAI and Anthropic on the near-term roadmap. Most platforms in this list surface AI cost as a summary line rather than per-model attribution. Ask every vendor to demonstrate per-model inference cost visibility during your evaluation.
Does cloud cost visibility software require write access to my cloud?
No. Amnic, Vantage, and Datadog operate on read-only access. Tools that automate purchasing or rightsizing, including parts of nOps and Harness CCM, require write access. Confirm with your security team before evaluating any automation-first platform, because a tool that requires write access may spend months in security review before it can be deployed.
Which multi-cloud cost visibility tools are best for Azure?
For AWS Azure cloud cost visibility software, Amnic provides Azure billing export ingestion with storage tier breakdown, Azure Blob cost by tier and access pattern, and Azure cross-region egress attribution. Cloudability and Vantage also cover Azure alongside AWS and GCP. Harness and nOps have thinner Azure depth compared to their AWS coverage.
How long does it take to deploy cloud cost visibility software?
Read-only platforms like Amnic and Vantage onboard in hours. Enterprise platforms like Apptio Cloudability and IBM Turbonomic take 6 to 12 weeks and typically require professional services. Always ask the vendor to show a real customer dashboard at 30 days post-kickoff, not a demo environment.
See Every Cloud Dollar Before Your Next Board Review
If you cannot answer in under 60 seconds which S3 storage class is wasting budget, which NAT Gateway is processing data for a workload no one recognizes, or how much your Bedrock inference cost changed since last Tuesday, the visibility gap is costing your team money it cannot measure.
Amnic connects to your cloud in under an hour with read-only access and surfaces your full cost breakdown across compute, storage tiers, network paths, Kubernetes containers, and AI workloads before you make any changes. Book your free 30-day Runtime Accountability Audit and see exactly where every dollar is going.
Start your free 30 day cloud cost visibility audit
Related Articles:
Better visibility and management into AI Tokens?
Start with a 30 day trial
Connect leading LLMs
24 hour time to value
Stay ahead of AI Spend

Make AI spend visible, controllable, and accountable.
Gain insights into your AI token costs at a team, customer, business unit and individual user level to measure and manage AI utilization.
Recommended Articles

8 Best Llama Cost Management Tools in 2026
Read More

8 Best Amazon Bedrock Cost Optimization Tools for 2026
Read More

7 Best Amazon Bedrock Cost Monitoring Tools
Read More

8 Best Gemini Cost Visibility Tools for 2026
Read More

7 Best Multimodal Cost Optimization Tools for 2026
Read More

5 Best Anthropic Cost Allocation Tools for 2026
Read More


