Analyzing Network Traffic with VPC Flow Logs: A Comprehensive Guide
12 min read
Cloud 101

Table of Contents
When you're running applications in the cloud, understanding what's happening inside your network can feel like trying to see through fog. VPC Flow Logs cut through that uncertainty by capturing detailed information about IP traffic moving through your Virtual Private Cloud. Think of them as your network's flight recorder, continuously documenting every connection attempt, successful transmission, and blocked request across your cloud infrastructure.
These logs aren't just data dumps. They're essential tools for analyzing network traffic patterns, spotting security threats before they escalate, and diagnosing those frustrating connectivity problems that seem to appear out of nowhere. Whether you're investigating why an application can't reach a database or tracking down suspicious activity from an unfamiliar IP address, VPC Flow Logs provide the visibility you need.
AWS VPC Flow Logs specifically offer deep integration with the broader AWS ecosystem, making them particularly powerful for organizations already invested in Amazon's cloud platform. They capture metadata like source and destination addresses, ports, protocols, and whether traffic was accepted or rejected, all without the overhead of full packet capture.
This blog walks you through everything you need to know about VPC Flow Logs:
Understanding how flow logs work and what they capture
Enabling and configuring them effectively in AWS
Analyzing the data to improve security and troubleshoot issues
Best practices for managing costs while maintaining visibility
Real-world use cases that demonstrate their practical value
Understanding VPC Flow Logs
VPC Flow Logs are a tool used to capture and record network traffic within your Virtual Private Cloud (VPC) infrastructure. They provide a detailed account of communication between resources in your cloud environment, similar to a journal documenting every conversation.
How VPC Flow Logs Work
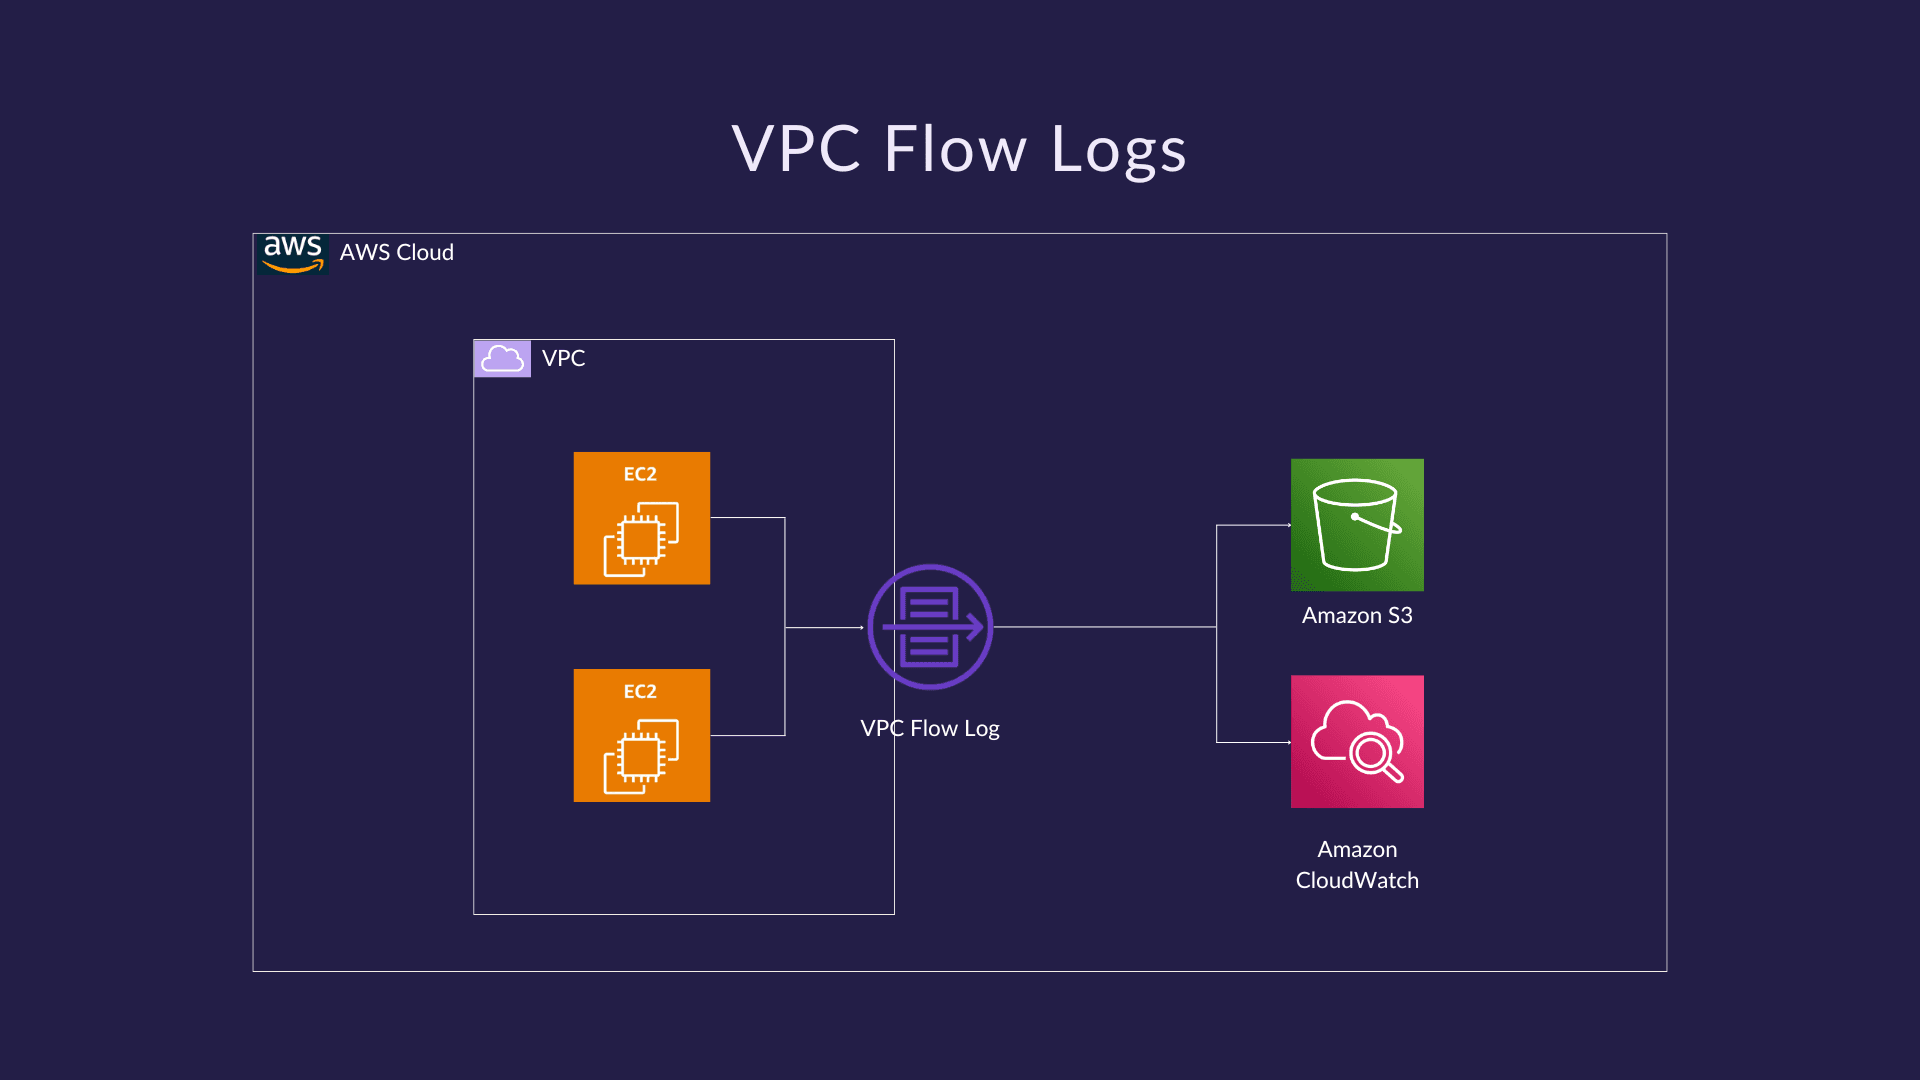
These logs operate at the network interface level, meaning they capture traffic data as packets move through your VPC without actually inspecting the contents of those packets. The logging mechanism works by monitoring network interfaces attached to various cloud resources such as virtual machines, load balancers, or database instances.
When traffic flows through these interfaces, the flow log service collects important information about each connection and compiles it into flow records. These records are organized using flow logs aggregation, which groups traffic data into manageable records based on IP connection tuples, a unique combination of:
Source IP address
Destination IP address
Source port
Destination port
Protocol type
If packets match these criteria within a designated time period (usually 60 seconds), they are combined into a single flow log entry. This approach prevents excessive log volume while still retaining meaningful traffic insights.
What Gets Recorded
Each flow log entry contains rich metadata that paints a picture of your network activity:
Source and destination IP addresses: Identifies who's talking to whom in your network
Source and destination ports: Shows which services or applications are being accessed
Protocol information: Documents whether the traffic uses TCP, UDP, ICMP, or other protocols
Packet and byte counts: Quantifies the volume of data transferred during the connection
Timestamps: Records when the traffic flow started and ended
Action taken: Indicates whether the traffic was ACCEPTed or REJECTed by your security rules
The acceptance or rejection status proves particularly valuable because it reveals how your security groups and network ACLs are handling traffic. A rejected connection might indicate a misconfigured security rule or potentially malicious activity attempting to breach your defenses. This metadata collection happens passively, meaning your application performance remains unaffected while comprehensive network visibility is maintained.
Configuring Flow Logs at Different Levels
You have the flexibility to set up flow logs at various levels within your VPC architecture, depending on how detailed you want your traffic monitoring to be:
Network interfaces: Attach flow logs directly to individual elastic network interfaces (ENIs) for targeted monitoring of specific instances or services.
Subnets: Enable flow logs at the subnet level to capture all traffic flowing through every network interface within that subnet.
VPC-wide: Apply flow logs across your entire VPC to gain comprehensive visibility into all network activity.
This hierarchical approach allows you to start with a broad view and then narrow down as necessary or concentrate your monitoring efforts on particular high-value assets.
Choosing Storage Destinations for Flow Log Data
After the flow log data has been captured and aggregated, it needs somewhere to be stored. AWS offers two main options for this:
Amazon CloudWatch Logs: This is ideal for real-time monitoring and analysis. With CloudWatch Logs, you can query data immediately, set up metric filters, and create alarms based on traffic patterns. It also integrates with CloudWatch Insights for advanced querying capabilities.
Amazon S3: This option is better suited for long-term storage and batch analysis. Amazon S3 provides cost-effective archival of flow logs, making it suitable when you need to keep historical data for compliance reasons or perform periodic analysis using tools like Amazon Athena.
The aggregation window ensures that even in environments with high traffic volume, only manageable amounts of log data are generated while still retaining the important details needed for network analysis.
Key Features of AWS VPC Flow Logs
AWS VPC Flow Logs stand out through their seamless integration with the broader AWS ecosystem. The feature connects directly with Amazon CloudWatch Logs for real-time monitoring and Amazon S3 for long-term storage and analysis. This native integration means you can immediately start querying flow log data using CloudWatch Insights or build custom analytics pipelines using services like Amazon Athena, AWS Lambda, and Amazon Kinesis Data Firehose. The data flows naturally into your existing AWS infrastructure without requiring third-party connectors or complex data transformation processes.
Monitoring Capabilities
The monitoring capabilities of AWS VPC Flow Logs provide granular visibility into how security groups and network ACLs handle traffic decisions. When you examine flow log records, you'll see whether traffic was accepted or rejected, along with the specific rule that made the decision. This visibility proves invaluable when:
Validating that security group rules work as intended
Identifying overly permissive or restrictive ACL configurations
Troubleshooting why legitimate traffic gets blocked
Auditing network access patterns for compliance requirements
Flexible Filtering Options
AWS gives you precise control over which traffic gets logged through flexible filtering options. You can configure flow logs to capture:
Accepted traffic only - useful for understanding normal traffic patterns and optimizing security rules
Rejected traffic only - ideal for security monitoring and identifying potential threats or misconfigurations
All traffic - provides complete visibility, but generates more data and associated storage costs
This flexibility extends to the scope of logging as well. You can enable AWS flow logs at the VPC level to capture everything, or narrow the focus to specific subnets or individual network interfaces. This granular approach lets you balance comprehensive monitoring needs against cost and data volume considerations, creating a logging strategy that matches your specific operational requirements.
Enabling and Configuring VPC Flow Logs in AWS
Getting started with AWS flow logs setup requires just a few clicks in the AWS Management Console. You can enable VPC flow logs at three different levels: for an entire VPC, a specific subnet, or an individual network interface (ENI). Each level offers different granularity depending on your monitoring needs.
Setting Up Flow Logs Through the Console
Navigate to the VPC Dashboard in your AWS Console
Select the resource you want to monitor (VPC, subnet, or network interface)
Choose "Create flow log" from the Actions menu
Configure your flow log settings based on your requirements
Selecting Your Log Record Type
When configuring flow logs, you'll need to decide what traffic to capture:
Accepted traffic: Records only successful connections that passed the security group and ACL rules
Rejected traffic: Captures blocked connection attempts, useful for security analysis
All traffic: Provides complete visibility but generates higher data volumes
Choosing the Right Destination
AWS offers two primary storage options for flow log data:
Amazon CloudWatch Logs: Ideal for real-time analysis and quick queries using CloudWatch Insights. Best suited for active monitoring scenarios where you need immediate access to log data.
Amazon S3: Cost-effective for long-term storage and compliance requirements. Perfect when you're dealing with large volumes of historical data or need to integrate with third-party analytics tools.
Best Practices for Configuration
Start with a limited scope when first implementing flow logs. Enable logging on a single subnet or network interface to understand data volumes and costs before scaling up. Use custom log formats to capture only the fields you actually need, reducing storage costs and improving query performance. Tag your flow logs appropriately to maintain organization across multiple AWS accounts and regions. Set up IAM roles with least-privilege permissions to ensure secure access to flow log data.
Use Cases of VPC Flow Logs in Network Traffic Analysis
Organizations across industries rely on VPC Flow Logs to solve complex networking challenges and maintain robust security postures. The practical applications extend far beyond basic monitoring, offering tangible solutions to everyday operational problems.
1. Security Incident Investigation
When a security team detects suspicious activity, VPC Flow Logs become the first line of investigation. A financial services company discovered unauthorized access attempts by analyzing rejected connection logs, revealing a pattern of failed SSH attempts from international IP addresses. The flow logs provided exact timestamps, source IPs, and targeted ports, enabling the team to block malicious actors and patch vulnerable instances within hours.
2. Application Performance Troubleshooting
Development teams frequently use flow logs to diagnose connectivity issues between microservices. An e-commerce platform experiencing intermittent checkout failures used flow logs to identify that traffic between their payment processing service and database was being rejected by overly restrictive security group rules. The logs showed specific port numbers and protocols being blocked, allowing engineers to adjust rules without compromising security.
3. Compliance and Audit Requirements
Healthcare organizations utilize flow logs to demonstrate compliance with data protection regulations. By maintaining detailed records of all network communications, they can prove that patient data systems only communicate with approved services and geographic regions. The logs serve as immutable evidence during audits, showing exactly which systems accessed sensitive databases and when.
4. Network Capacity Planning
IT operations teams analyze flow log patterns to understand bandwidth utilization across different times and regions. A media streaming service identified peak usage periods and geographic hotspots by examining flow log volume and destination patterns, informing decisions about where to deploy additional infrastructure and optimize content delivery networks.
5. Cost Optimization
Organizations identify unnecessary data transfers between availability zones or regions by examining flow logs for high-volume connections. One SaaS provider reduced their AWS bill by 30% after discovering that development environments were unnecessarily syncing large datasets across regions multiple times daily.
Enhancing Security Posture with VPC Flow Logs
Security monitoring with flow logs transforms reactive security approaches into proactive defense strategies. By examining the traffic patterns captured in VPC Flow Logs, security teams can identify exactly which connections are being established, from where, and whether they align with expected behavior.
Tightening Security Groups Based on Traffic Patterns
VPC Flow Logs reveal the actual communication patterns within your network infrastructure. This visibility allows you to:
Identify unused ports and protocols that remain open in security group rules
Discover legitimate traffic patterns that weren't previously documented
Remove overly permissive rules that allow broader access than necessary
Create more granular security group configurations based on real-world usage
For example, if your flow logs consistently show that a database server only receives connections on port 3306 from specific application servers, you can confidently restrict the security group to allow only that traffic instead of maintaining broader access rules "just in case."
Detecting Anomalies and Suspicious Activity
Flow log analysis serves as an early warning system for potential security incidents. By establishing baseline traffic patterns, you can quickly spot deviations that warrant investigation:
Unexpected connection attempts from unfamiliar IP addresses
Unusual spikes in rejected traffic indicating reconnaissance or scanning activity
Data exfiltration attempts are characterized by abnormal outbound traffic volumes
Lateral movement patterns where compromised instances attempt connections to multiple internal resources
Traffic to known malicious IP addresses or suspicious geographic locations
The metadata captured in flow logs, particularly the acceptance or rejection status, helps distinguish between successful attacks and blocked attempts. A sudden increase in rejected connections from a specific source might indicate an ongoing attack that your security groups are successfully blocking, while accepted connections to unusual destinations could signal a compromised resource.
Analyzing VPC Flow Log Data Efficiently
The true power of VPC Flow Logs comes into play when you can effectively parse and analyze the large amounts of data they produce. While the raw flow log entries contain valuable information, extracting meaningful patterns requires the right approach and tools.
Analyzing VPC Flow Logs with CloudWatch Logs Insights
CloudWatch Logs Insights is a native solution for analyzing VPC flow logs within AWS. This query language allows you to search through millions of log entries in seconds, filtering by specific IP addresses, ports, or traffic patterns. You can craft queries to identify top talkers in your network, track bandwidth consumption by source, or pinpoint rejected connection attempts that might indicate misconfigurations or security threats.
Analyzing VPC Flow Logs with Specialized Log Analytics Tools
For organizations dealing with petabytes of flow log data, specialized log analytics tools become essential:
Amazon Athena enables SQL-based queries directly against flow logs stored in S3, perfect for historical analysis and compliance reporting
Elasticsearch combined with Kibana provides real-time search capabilities and pre-built dashboards for network traffic analysis
Splunk and Sumo Logic offer enterprise-grade platforms with advanced correlation capabilities across multiple data sources
Integrating VPC Flow Logs into Your Monitoring Ecosystem
The true value of analyzing network traffic with VPC flow logs materializes when you integrate them into your broader monitoring ecosystem. Feeding flow log data into your SIEM (Security Information and Event Management) system creates a unified view of security events. Connecting flow logs with application performance monitoring tools helps correlate network behavior with application health metrics.
Transforming Data into Actionable Intelligence
Data visualization transforms raw numbers into actionable intelligence. Heat maps reveal traffic patterns across different time periods, helping identify peak usage windows. Network topology diagrams generated from flow log data show actual communication paths between resources. Time-series graphs track bandwidth utilization trends, making capacity planning decisions data-driven rather than guesswork.
Custom dashboards tailored to specific use cases, whether security monitoring, cost optimization, or performance troubleshooting—put the most relevant metrics at your fingertips without requiring manual log analysis.
Best Practices for Managing and Using VPC Flow Logs Effectively
Managing VPC Flow Logs at scale requires a strategic approach that balances comprehensive visibility with operational efficiency. The volume of data generated can quickly become overwhelming and expensive if not properly managed.
1. Optimize Costs with Selective Logging
Cost optimization flow logs start with selective logging. Rather than enabling flow logs across every resource in your VPC, identify critical components that require monitoring:
Production subnets handling sensitive data
Internet-facing network interfaces
Resources with strict compliance requirements
High-value assets requiring enhanced security monitoring
Consider filtering traffic types based on your specific needs. Logging only rejected traffic can significantly reduce data volume while still providing valuable security insights. For development environments, you might log accepted traffic only during troubleshooting periods rather than continuously.
2. Manage Storage Costs with Data Retention Policies
Data retention policies play a crucial role in managing storage costs. Different use cases demand different retention periods:
Compliance requirements: Typically 90 days to 1 year, depending on industry regulations
Security investigations: 30-60 days for most incident response scenarios
Operational troubleshooting: 7-14 days is often sufficient for connectivity issues
Long-term trend analysis: Consider archiving to lower-cost storage tiers like S3 Glacier
Implement lifecycle policies that automatically transition older logs to cheaper storage classes or delete them after specified periods. This approach maintains recent data for quick access while reducing costs for historical records.
3. Review and Adjust Your Logging Configuration Regularly
Best practices VPC flow logs also include regular review of your logging configuration. Traffic patterns evolve as your infrastructure grows, and what made sense initially may need adjustment. Schedule quarterly audits to:
Evaluate which resources still require flow logging
Assess whether current retention periods align with actual usage
Review storage costs against the value provided
Identify opportunities to optimize log formats or reduce unnecessary fields
Utilize AWS Cost Explorer to track flow log expenses and identify cost spikes that might indicate misconfigured resources or unexpected traffic patterns.
Exploring Challenges and Limitations Associated with Using VPC Flow Logs
While VPC Flow Logs provide valuable insights into network traffic patterns, understanding their limitations helps organizations set realistic expectations and plan complementary monitoring strategies.
1. Lack of Packet-Level Visibility
VPC Flow Logs capture connection-level metadata rather than actual packet contents. This means you can see that traffic occurred between two endpoints, but not what data was transmitted. For deep protocol analysis or investigating specific application-layer issues, this limitation becomes apparent. Security teams investigating potential data exfiltration or compliance violations may find themselves unable to verify the actual content of suspicious connections.
2. Log Delivery Delays
Flow logs aren't instantaneous. AWS typically delivers log records within 10-15 minutes of the actual network activity, though this can vary. Organizations requiring real-time threat detection or immediate incident response capabilities face a significant blind spot. By the time suspicious activity appears in flow logs, attackers may have already completed their objectives.
3. Aggregation Gaps
The aggregation window used by VPC Flow Logs can mask short-lived connections or rapid-fire connection attempts. Port scanning activities or quick reconnaissance probes might be underrepresented in the aggregated data, making certain attack patterns harder to detect.
4. Volume and Noise
High-traffic environments generate massive amounts of flow log data, creating challenges in identifying meaningful patterns among routine traffic. The sheer volume can overwhelm analysis tools and increase storage costs significantly.
Amnic VPC Flow Logs Integration
Amnic’s integration with VPC Flow Logs empowers users to gain unparalleled visibility into their network traffic and enables effective monitoring of data transfer flows, congestion detection, and identification of cost-saving opportunities. This feature combines comprehensive network activity insights with advanced analysis tools to help optimize resources and quickly spot anomalies.
Seamless Onboarding & Setup
Quick Configuration: Easily connect VPC Flow Logs via the Integrations page under "Other Integrations."
Daily Data Retrieval: Generate and retrieve flow logs daily, automatically sending data to your Amazon S3 bucket.
Integrated Management: Includes IAM policy updates and validation steps to ensure secure and smooth setup.
Documentation Support: Detailed guidance available to help you attach your flow logs correctly.
Centralized Flow Logs Management
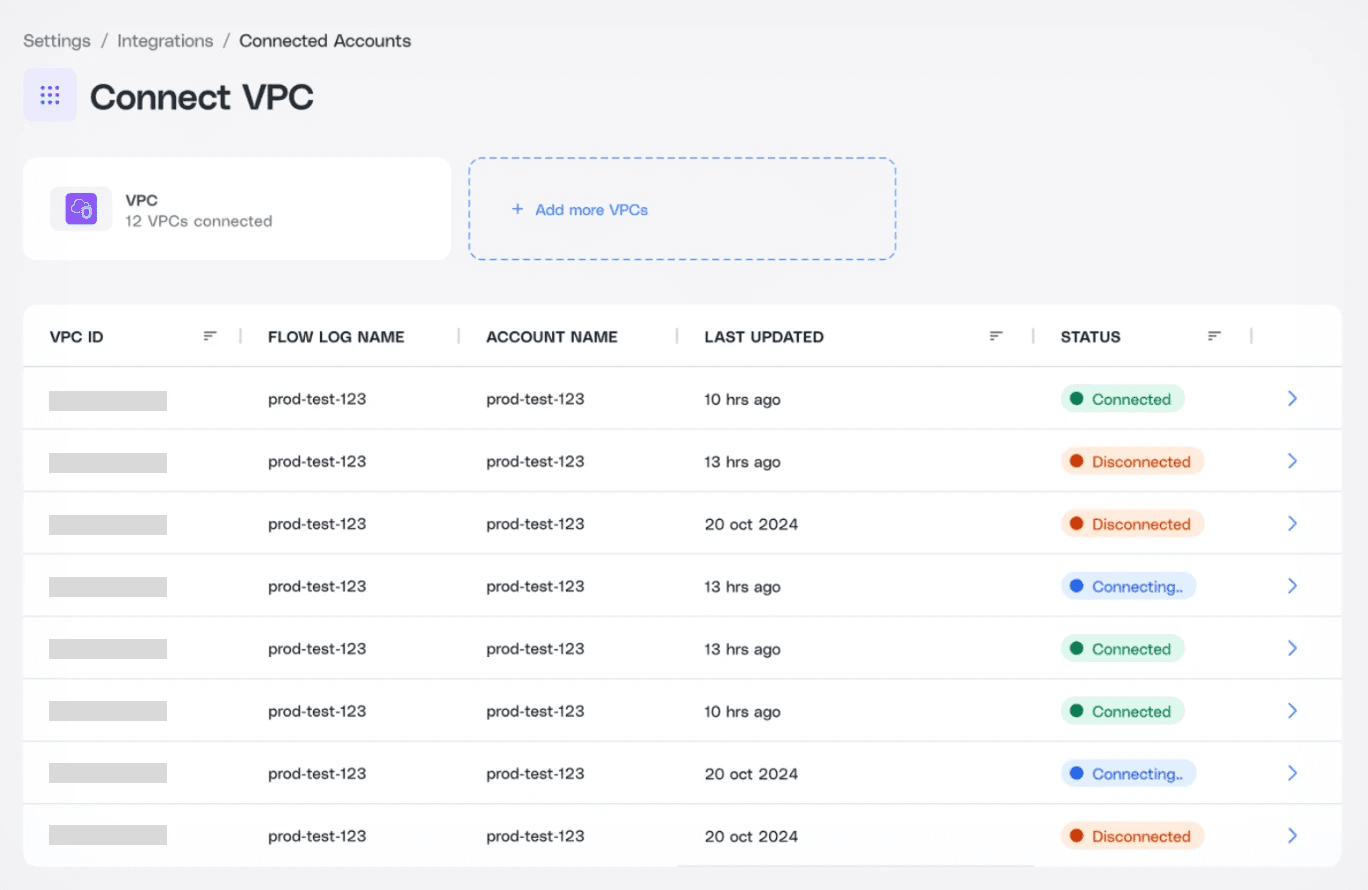
View detailed information on all connected flow logs.
Add new VPCs or delete existing flow logs effortlessly.
Manage all your flow log connections from a single intuitive interface.
In-depth NAT Usage Analysis
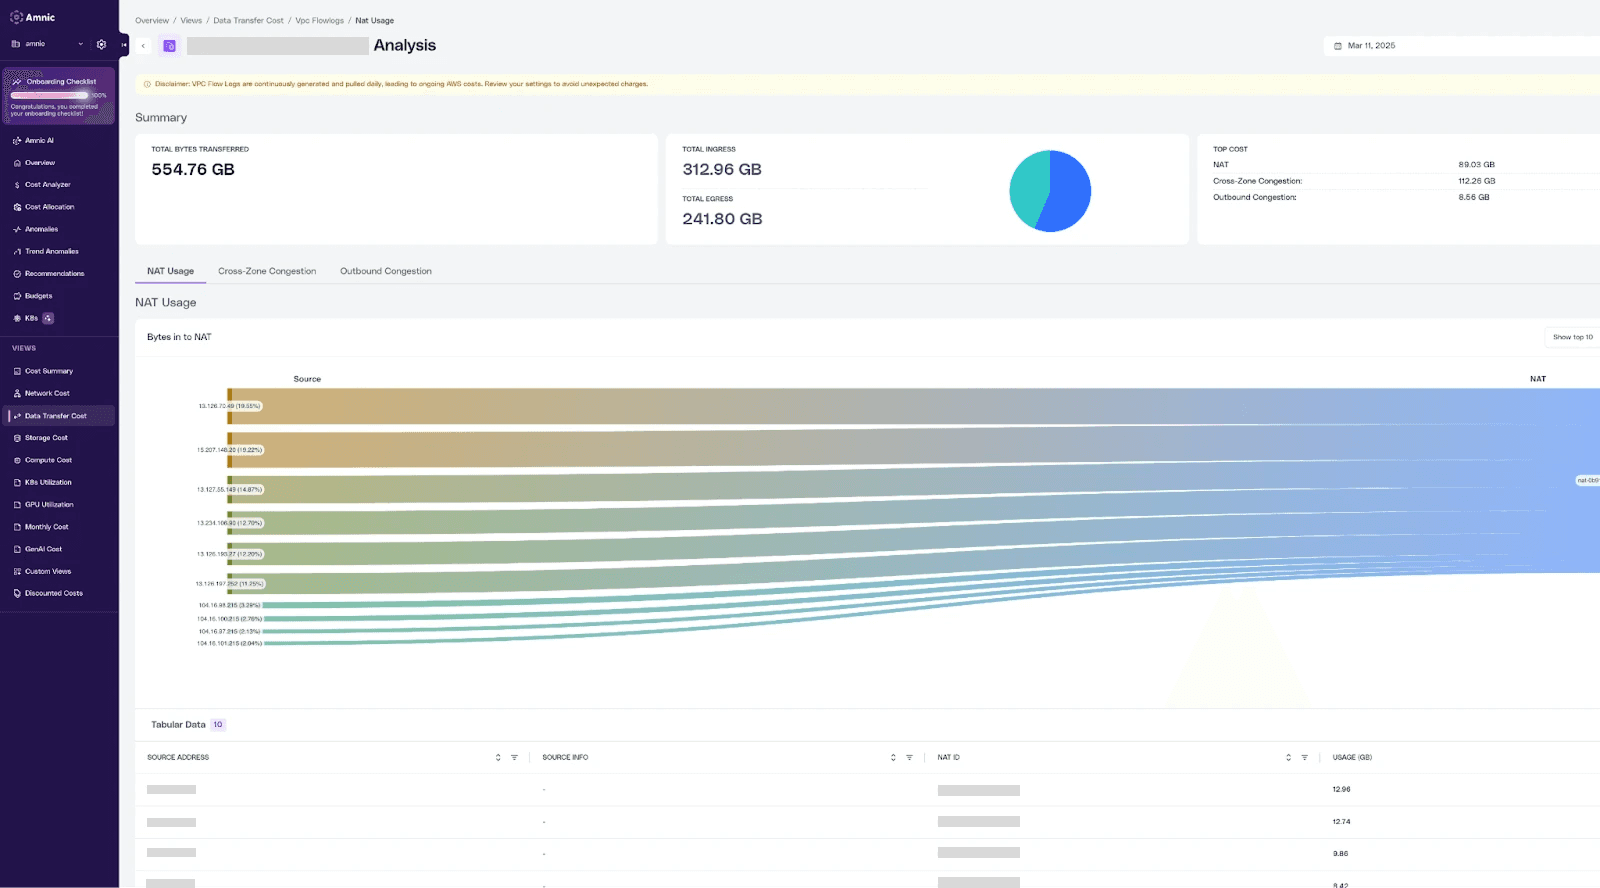
Visualize bytes flowing through NAT Gateways with breakdowns by top IP addresses and their services.
Flexible views switch seamlessly between Sankey charts and tables for inbound/outbound traffic analysis.
Tables detail Source/Destination IPs, Services, and Bytes transferred, helping identify high-volume flows for optimization.
Cross-zone Congestion Insights
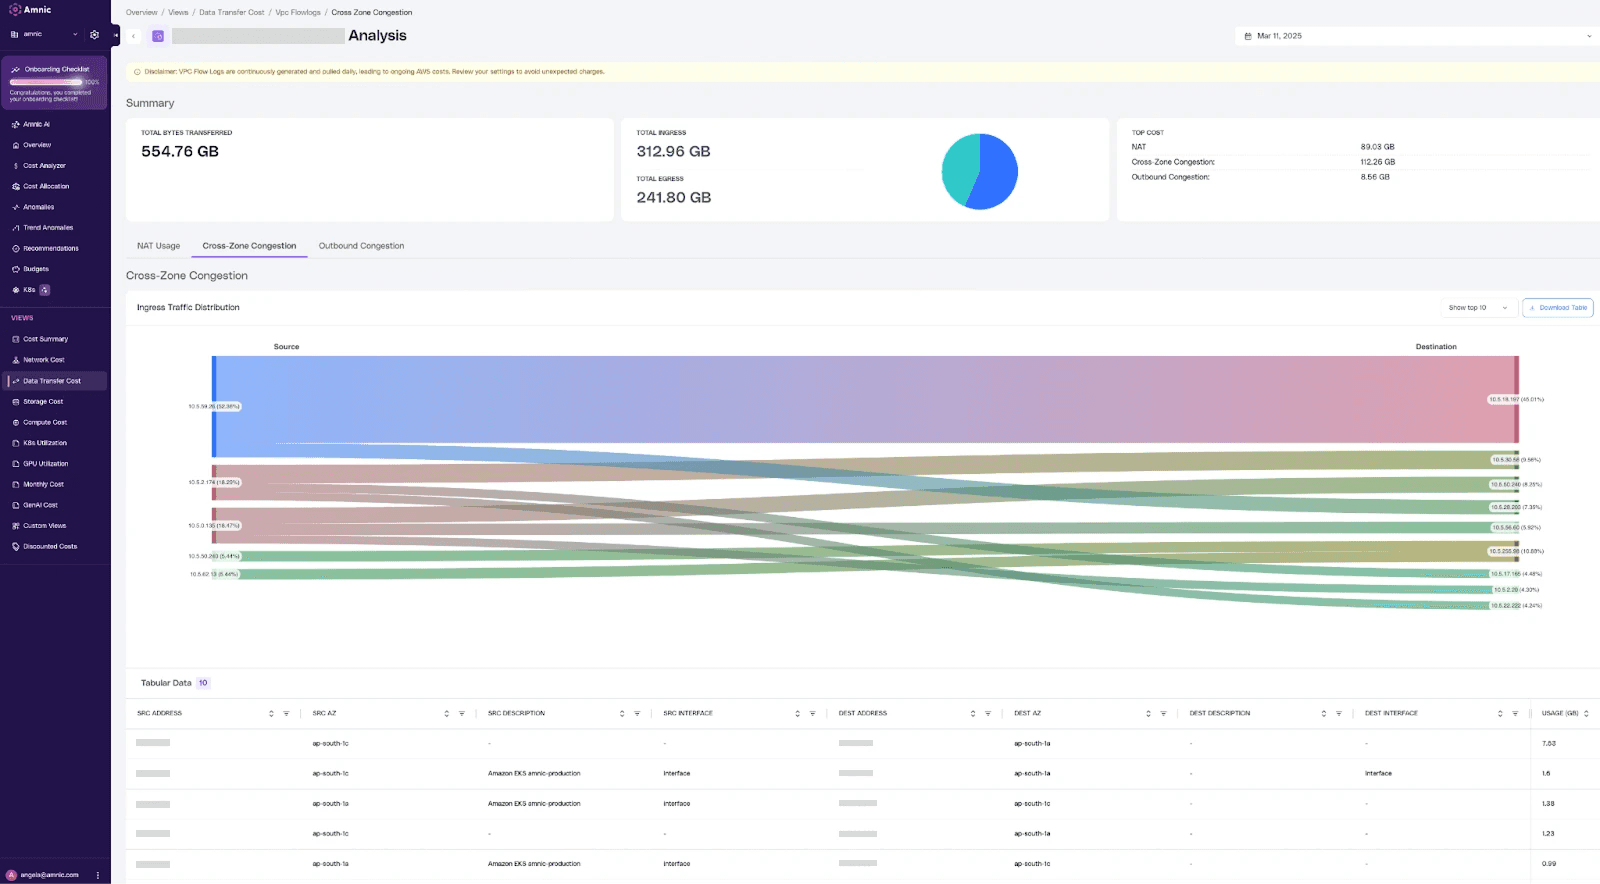
Interactive graphs reveal inter-zone data movements highlighting top transfers by volume.
Nodes sized by total bytes in/out represent IPs or services; edges show directional traffic flow between zones.
Default display includes both egress and ingress traffic, supplemented by a detailed table of source/destination IPs, direction, and bytes transferred.
Outbound Congestion Visualization

Sankey charts highlight outbound traffic flows clearly.
Filterable table views provide granular breakdowns by source or destination IPs for focused analysis.
Optimize Costs & Save on Cloud Spend
Instantly identify the top 50 highest-cost IP addresses incurring significant charges.
Detect expensive traffic patterns such as heavy NAT gateway usage, cross-zone transfers, and outbound traffic.
Use targeted insights to reduce unnecessary costs and improve cloud resource efficiency.
Why Choose Amnic for Your AWS VPC Flow Logs?
While AWS VPC Flow Logs offer critical metadata on network traffic, Amnic extends these capabilities significantly:
Interactive Visualization: Complex network relationships become clear through dynamic topology maps and detailed traffic flow diagrams that surpass basic log queries.
Intelligent Anomaly Detection: Machine learning algorithms continuously analyze flow data to detect unusual patterns indicating security threats or performance bottlenecks, drastically reducing manual effort.
Streamlined Troubleshooting: Guided workflows simplify investigation of connectivity issues without the need for complex query writing.
Enhanced Data Correlation: Amnic enriches raw flow log data with contextual AWS resource information, improving understanding of how traffic relates to your infrastructure components.
By integrating Amnic with your existing VPC Flow Logs setup, you transform raw log data into actionable intelligence that enhances visibility, security posture, operational efficiency, and cost management.
[Request a demo and speak to our experts]
[Get yourself a free 30-day trial with Amnic]
[Download our free FinOps resources]
FAQs (Frequently Asked Questions)
What are VPC Flow Logs and how do they work?
VPC Flow Logs are a tool used to capture and record network traffic at the network interface level within a Virtual Private Cloud (VPC). They operate by aggregating flow log records that capture metadata about IP connection tuples, which include details such as source and destination IP addresses, ports, and protocols. This enables detailed monitoring and analysis of network traffic patterns.
How can I configure VPC Flow Logs in AWS and choose the appropriate storage destination?
To configure VPC Flow Logs in AWS, you can navigate to the VPC Dashboard in the AWS Console and set up flow logs at various levels such as VPC, subnet, or network interface. When configuring, you'll select the log record type to determine what traffic is logged. For storage, AWS offers options like Amazon CloudWatch Logs for real-time monitoring or Amazon S3 for long-term storage and archival.
What are common use cases for analyzing network traffic with VPC Flow Logs?
Organizations use VPC Flow Logs for several critical purposes including security incident investigation by detecting suspicious activity, application performance troubleshooting to diagnose connectivity issues, compliance and audit requirements especially in regulated industries like healthcare, network capacity planning by analyzing traffic patterns, and cost optimization by identifying unnecessary data transfers between availability zones.
How do VPC Flow Logs enhance security posture in cloud environments?
VPC Flow Logs enhance security by providing visibility into actual communication patterns within your cloud infrastructure. They help tighten security groups based on observed traffic, detect anomalies and suspicious activities early through flow log analysis, and transform reactive security measures into proactive monitoring strategies that improve overall threat detection and response.
What tools can be used to analyze VPC Flow Log data effectively?
VPC Flow Log data can be analyzed efficiently using native AWS tools like CloudWatch Logs Insights for querying and visualizing logs. For organizations handling large volumes of data, specialized log analytics tools offer scalable solutions. Integrating these logs into your existing monitoring ecosystem allows transformation of raw data into actionable intelligence through data visualization and comprehensive analysis.
What are some best practices for managing VPC Flow Logs effectively while addressing challenges?
Effective management of VPC Flow Logs includes optimizing costs by selective logging to avoid unnecessary data capture, implementing data retention policies to manage storage expenses, regularly reviewing and adjusting logging configurations to maintain relevance, and being aware of limitations such as lack of packet-level visibility, log delivery delays, aggregation gaps that may mask short-lived connections, and managing high volumes of log data to reduce noise.
Recommended Articles
AI in FinOps: Where Cloud Cost Management Meets Intelligent Agents
5 FinOps Tools That Help You with Cost Allocation and Unit Economics
Better visibility and management into AI Tokens?
Start with a 30 day trial
Connect leading LLMs
24 hour time to value
Stay ahead of AI Spend

Make AI spend visible, controllable, and accountable.
Gain insights into your AI token costs at a team, customer, business unit and individual user level to measure and manage AI utilization.
Recommended Articles

What Is Cloud Cost Observability? Definition, Capabilities and Tools
Read More

Cloud Cost Anomaly Detection: How to Catch Surprise Spend Early
Read More

Cloud Cost Allocation Methods: 5 Models to Assign Cloud Spend Accurately
Read More

10 Cloud Cost Observability Metrics You Should Track
Read More

Cloud Adoption: Key Drivers, Challenges and How to Get It Right
Read More

What is a Content Delivery Network (CDN)? How It Works and What It Costs
Read More


