Reporting and Analytics
Simplify the process of disseminating cloud cost information across various teams and stakeholders
Simplify the process of disseminating cloud cost information across various teams and stakeholders
Simplify the process of disseminating cloud cost information across various teams and stakeholders
TRUSTED BY


humanify


TRUSTED BY


humanify


TRUSTED BY


humanify


Level up from outdated sheets and complex visualization software
FinOps, DevOps, and Cloud practitioners are tired of juggling spreadsheets or creating visualization reports with siloed cloud provider data. Manual reporting makes it difficult to track and manage cloud costs quickly, results in inaccurate data, and makes it complex to provide consistent cost updates with stakeholders. Instead of filling rows and columns in spreadsheets or continuously updating SQL queries, Amnic allows you to automate and expedite cloud cost reporting – taking minutes, not hours
Case Study
How cloud cost observability delivered recommendations
that lowered cluster costs by 50% for Jiffy.ai
Amnic proved instrumental in addressing the challenge of escalating Kubernetes cluster costs effectively for Jiffy.ai. Cloud cost observability was not only able to drive substantial cost savings, but also created a system of being able to continuously monitor costs and performance of their cloud infrastructure.
Read More
Read More


Features
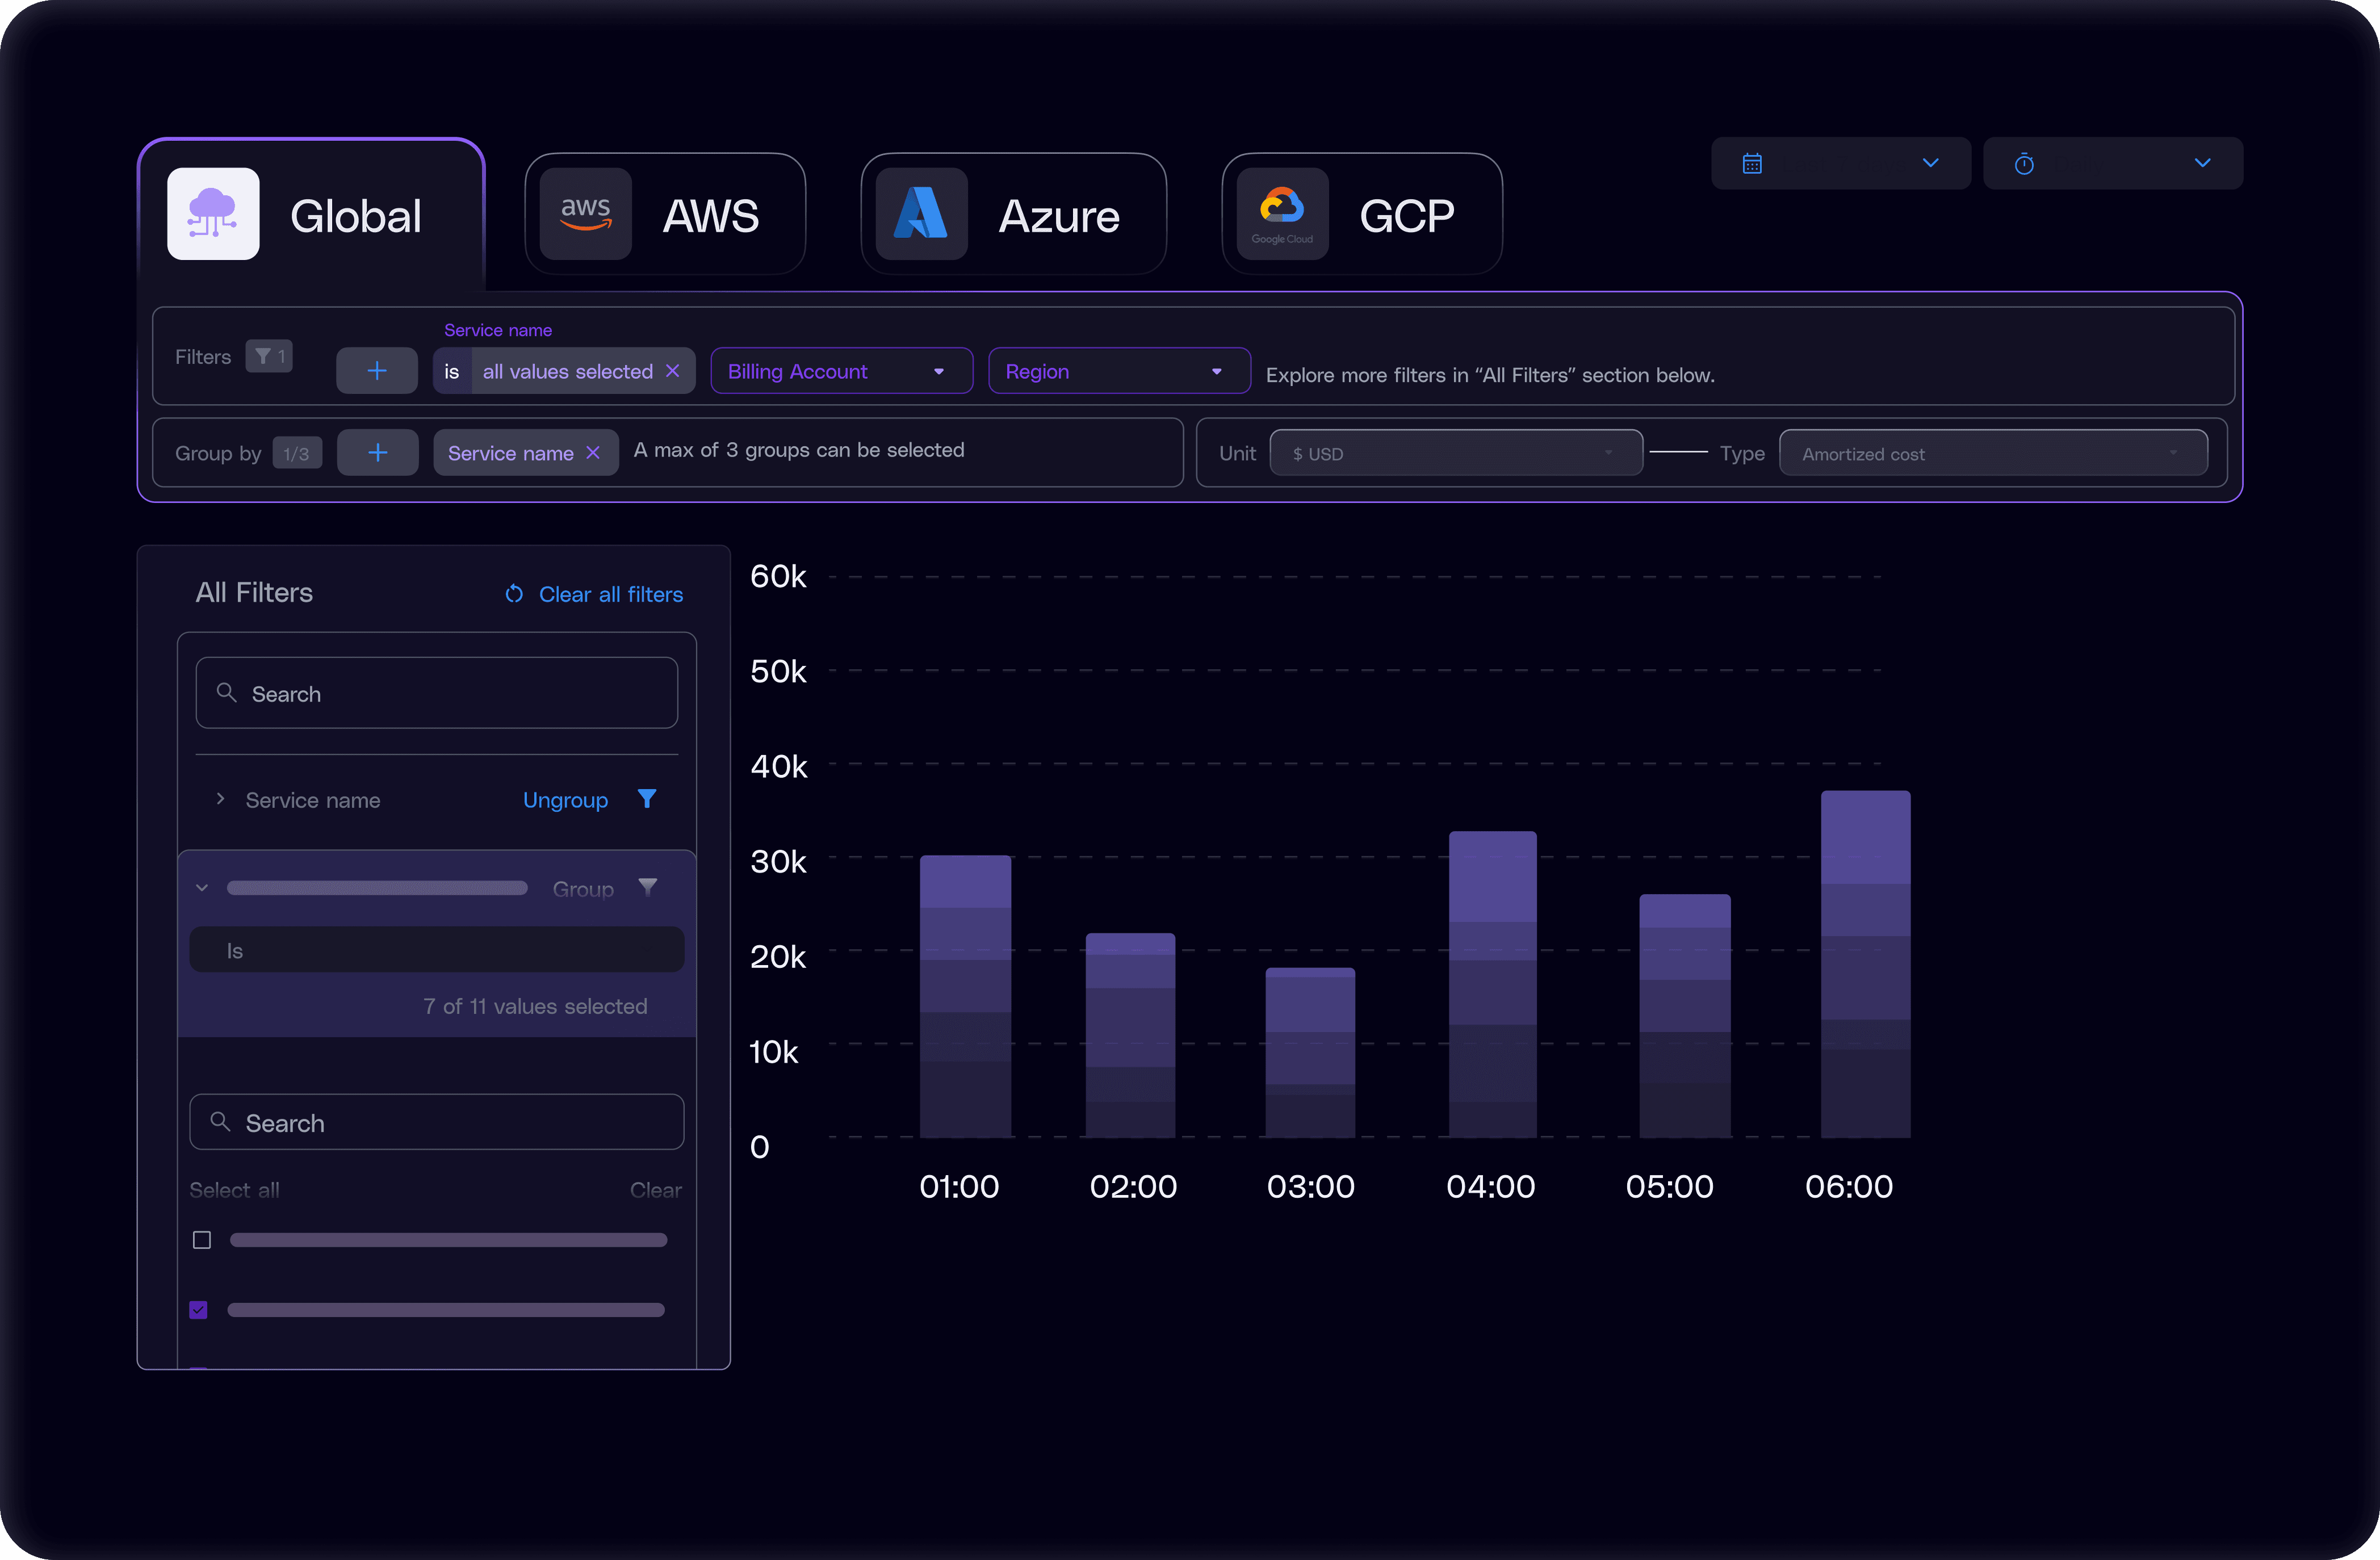

Cost Analyzer
Cost Analyzer
Cost Analyzer
A complete breakdown of cloud spending that can be filtered by date range, cloud provider, and more. Slice and dice costs by region, cloud provider, Billing or Resource ID, availability zone, categories and tags, SKU, and many other filters to identify the root cause of problematic spending.
A complete breakdown of cloud spending that can be filtered by date range, cloud provider, and more. Slice and dice costs by region, cloud provider, Billing or Resource ID, availability zone, categories and tags, SKU, and many other filters to identify the root cause of problematic spending.
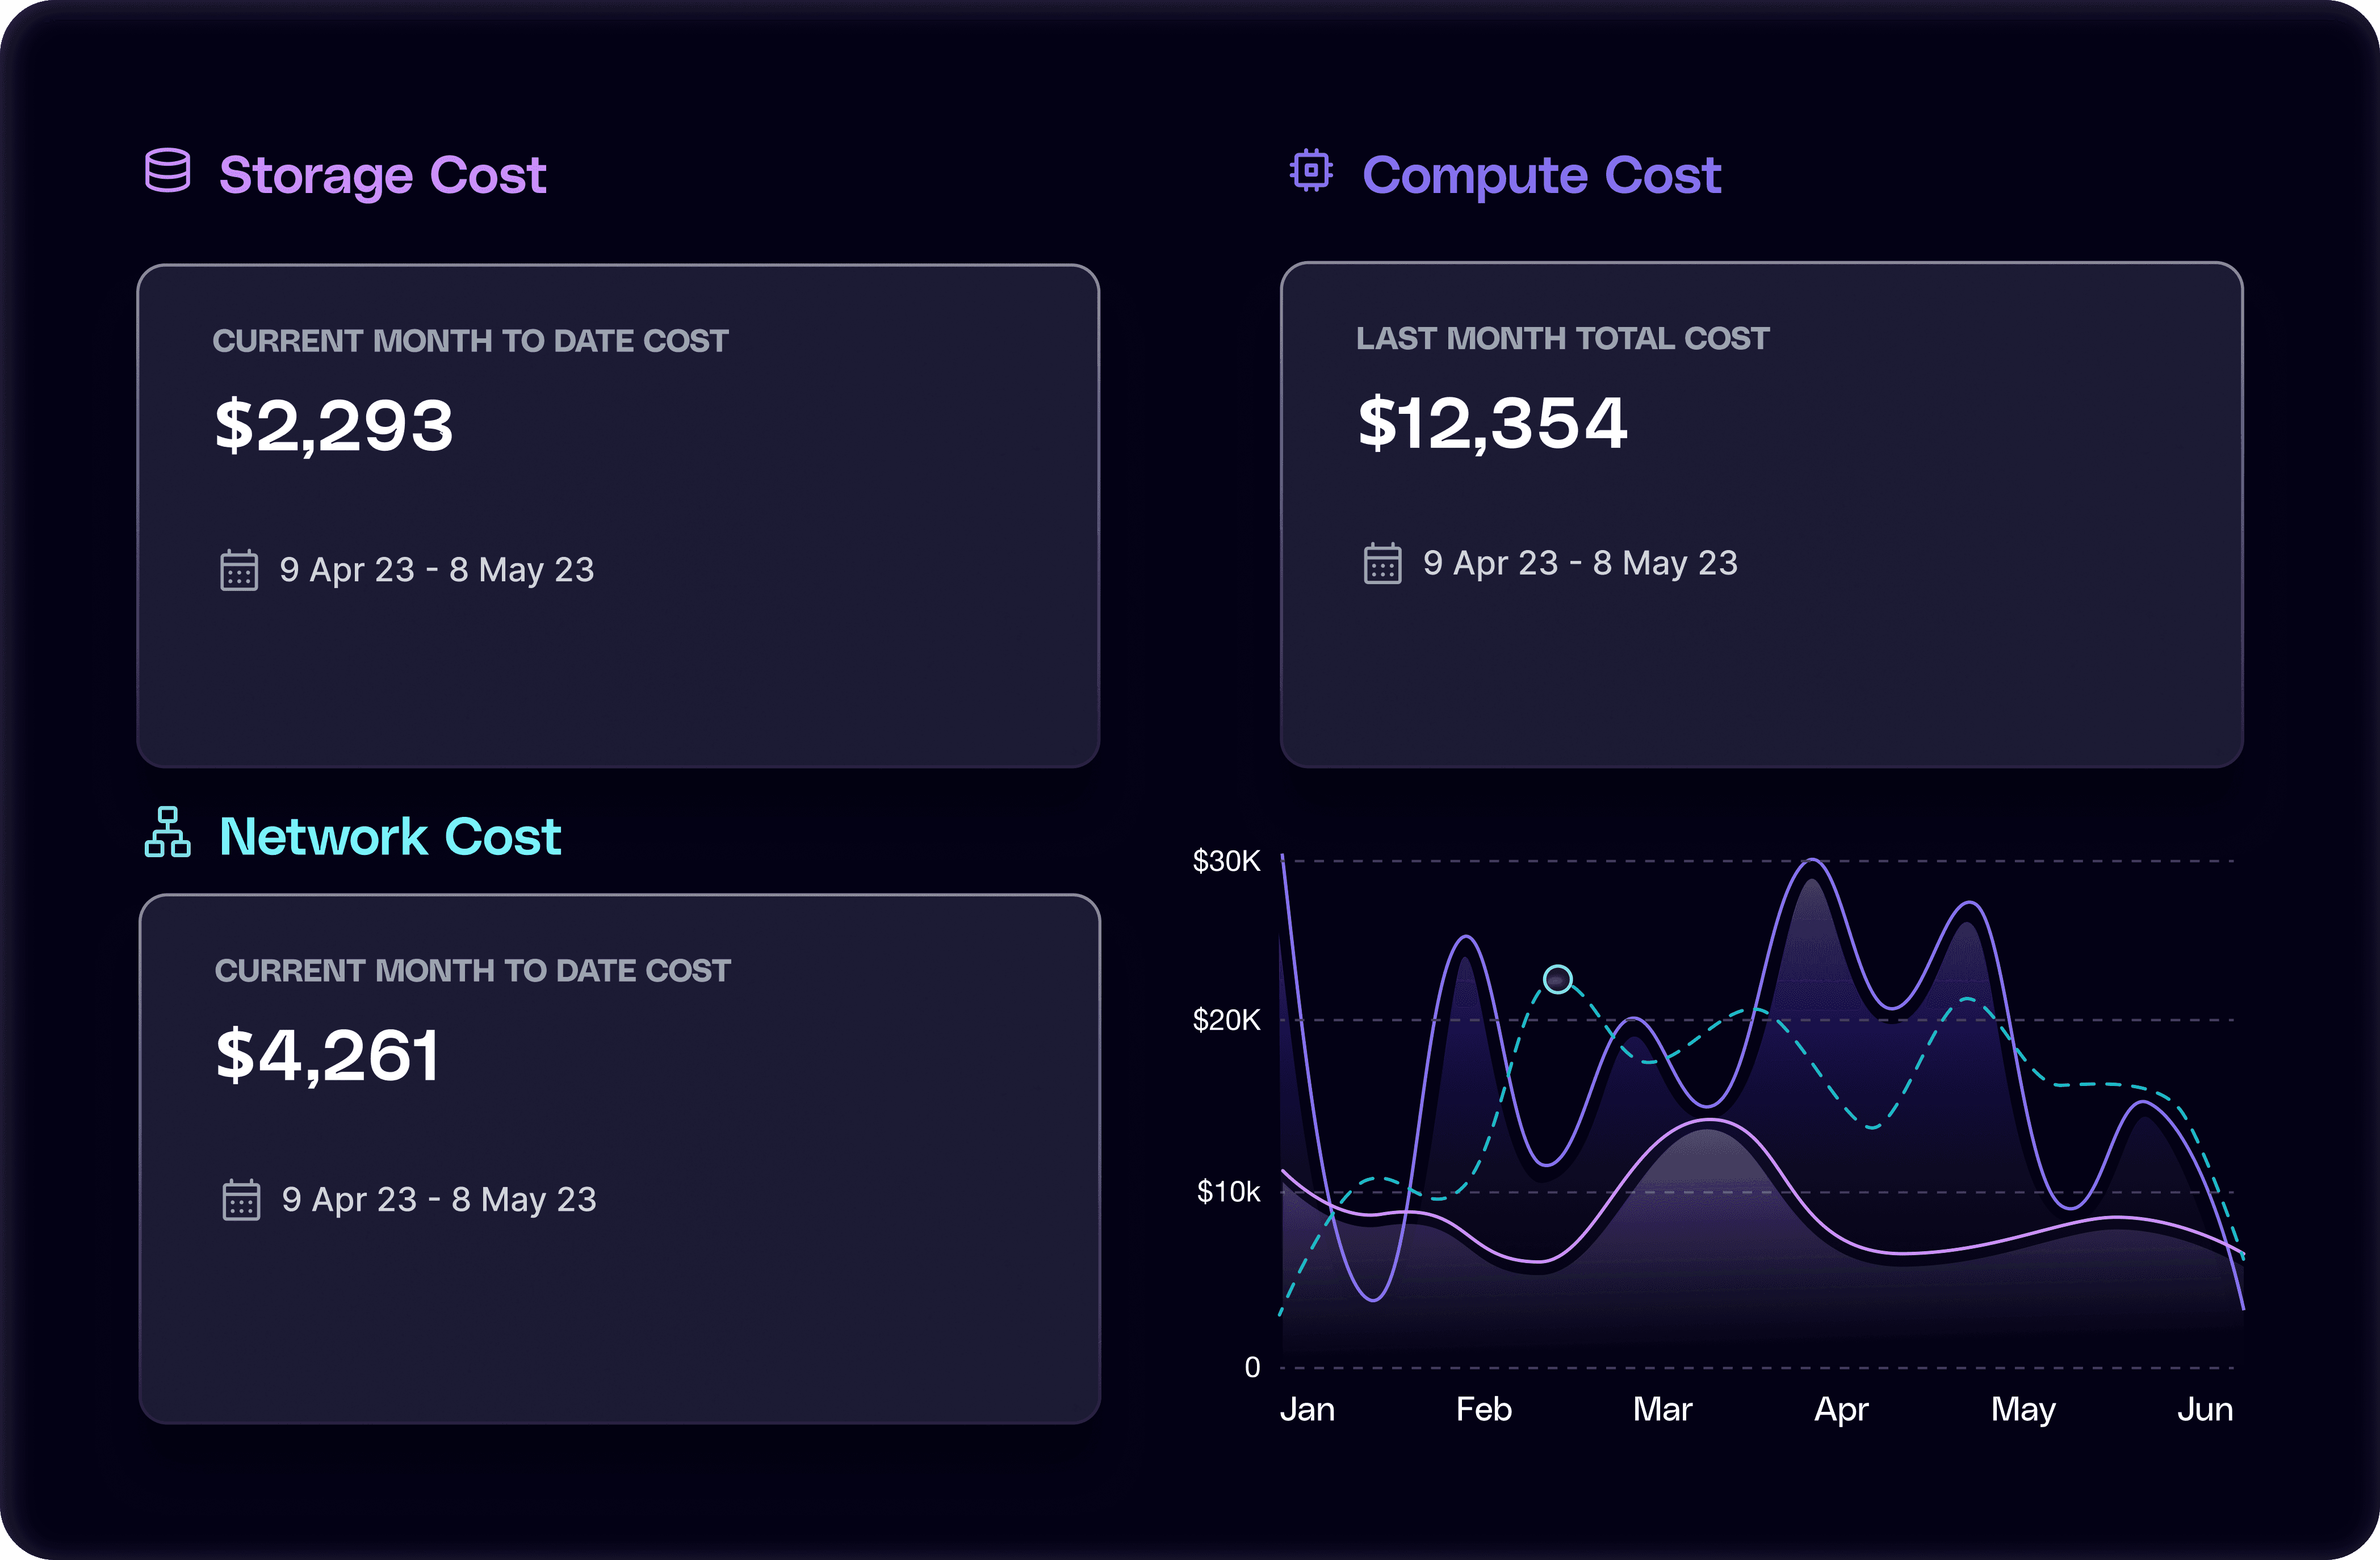

Category Views
Category Views
Category Views
Pre-built dashboards and reports for network, data transfer, storage, and compute costs. Instrumentation is automatic and fast, leading to improved cost management and reporting almost immediately.Help engineers and FinOps practitioners look at individual components of a system and understand which elements are most costly.
Pre-built dashboards and reports for network, data transfer, storage, and compute costs. Instrumentation is automatic and fast, leading to improved cost management and reporting almost immediately.Help engineers and FinOps practitioners look at individual components of a system and understand which elements are most costly.
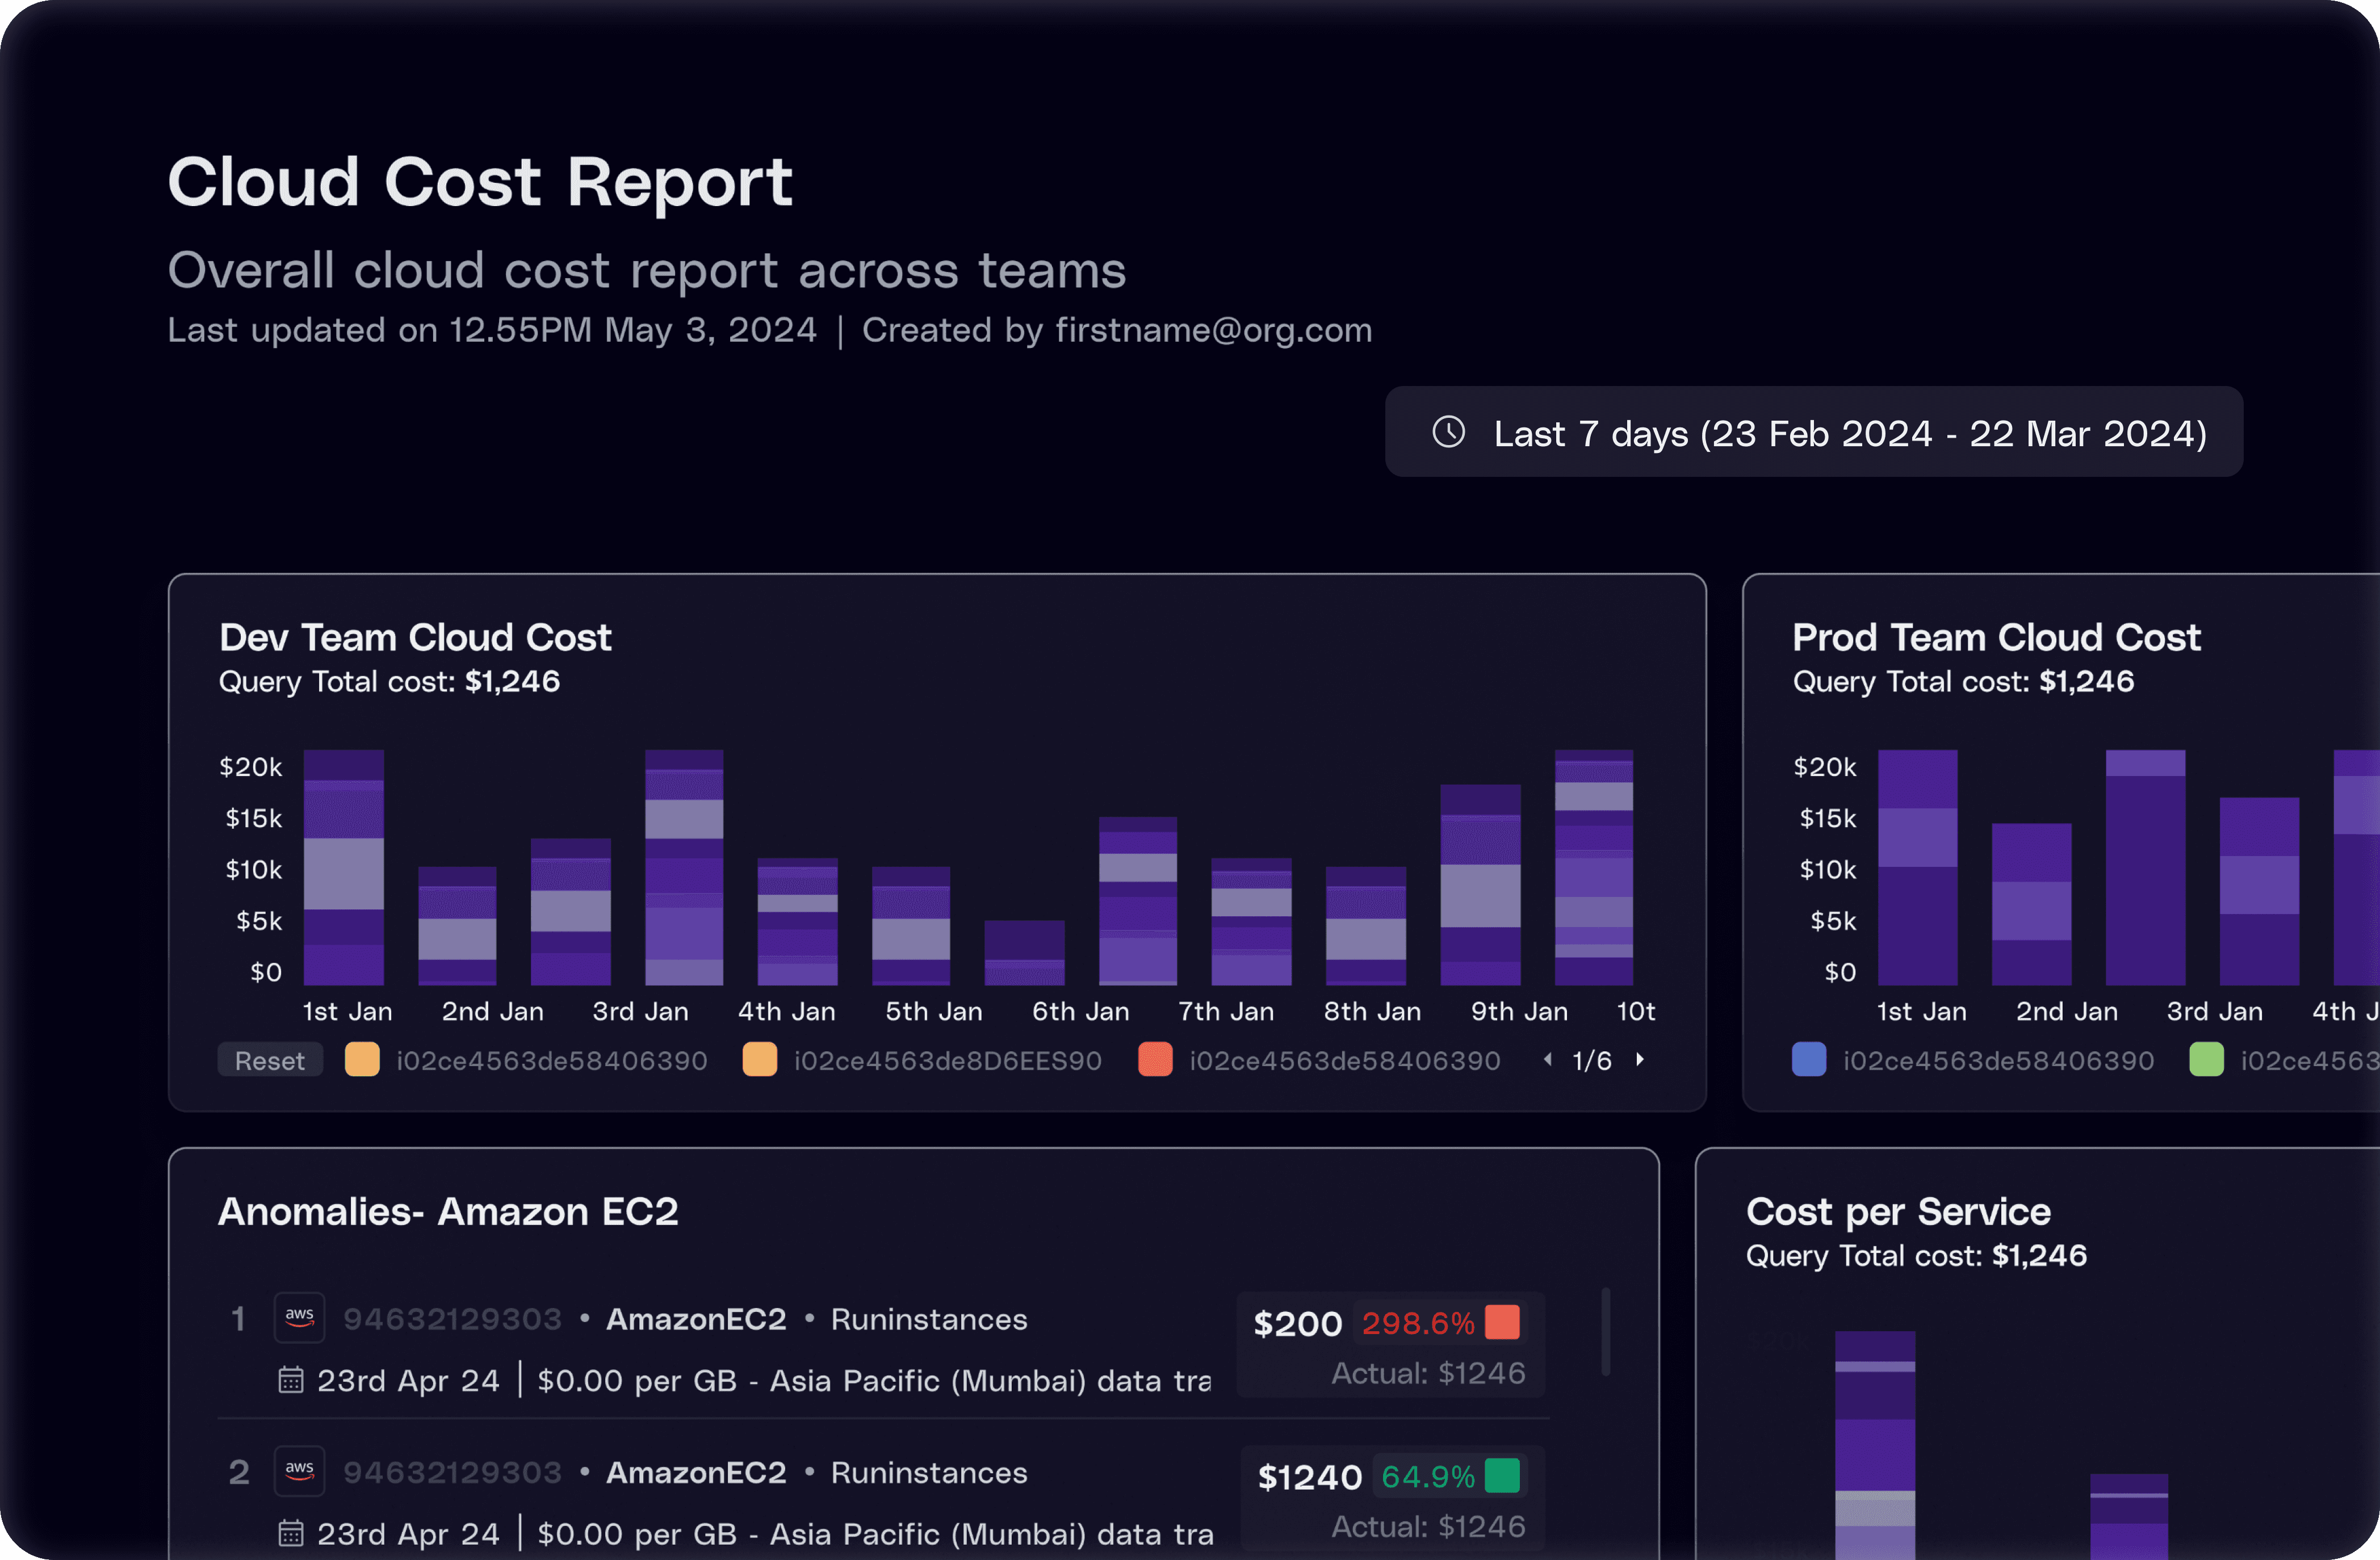

Custom Views and Reports
Custom Views and Reports
Custom Views and Reports
Create your own reports and dashboards with a few clicks. Users can track real-time deviations in cloud costs and maintain daily, weekly, or monthly reporting cadences with leadership teams and engineering managers without any additional work.
Create your own reports and dashboards with a few clicks. Users can track real-time deviations in cloud costs and maintain daily, weekly, or monthly reporting cadences with leadership teams and engineering managers without any additional work.
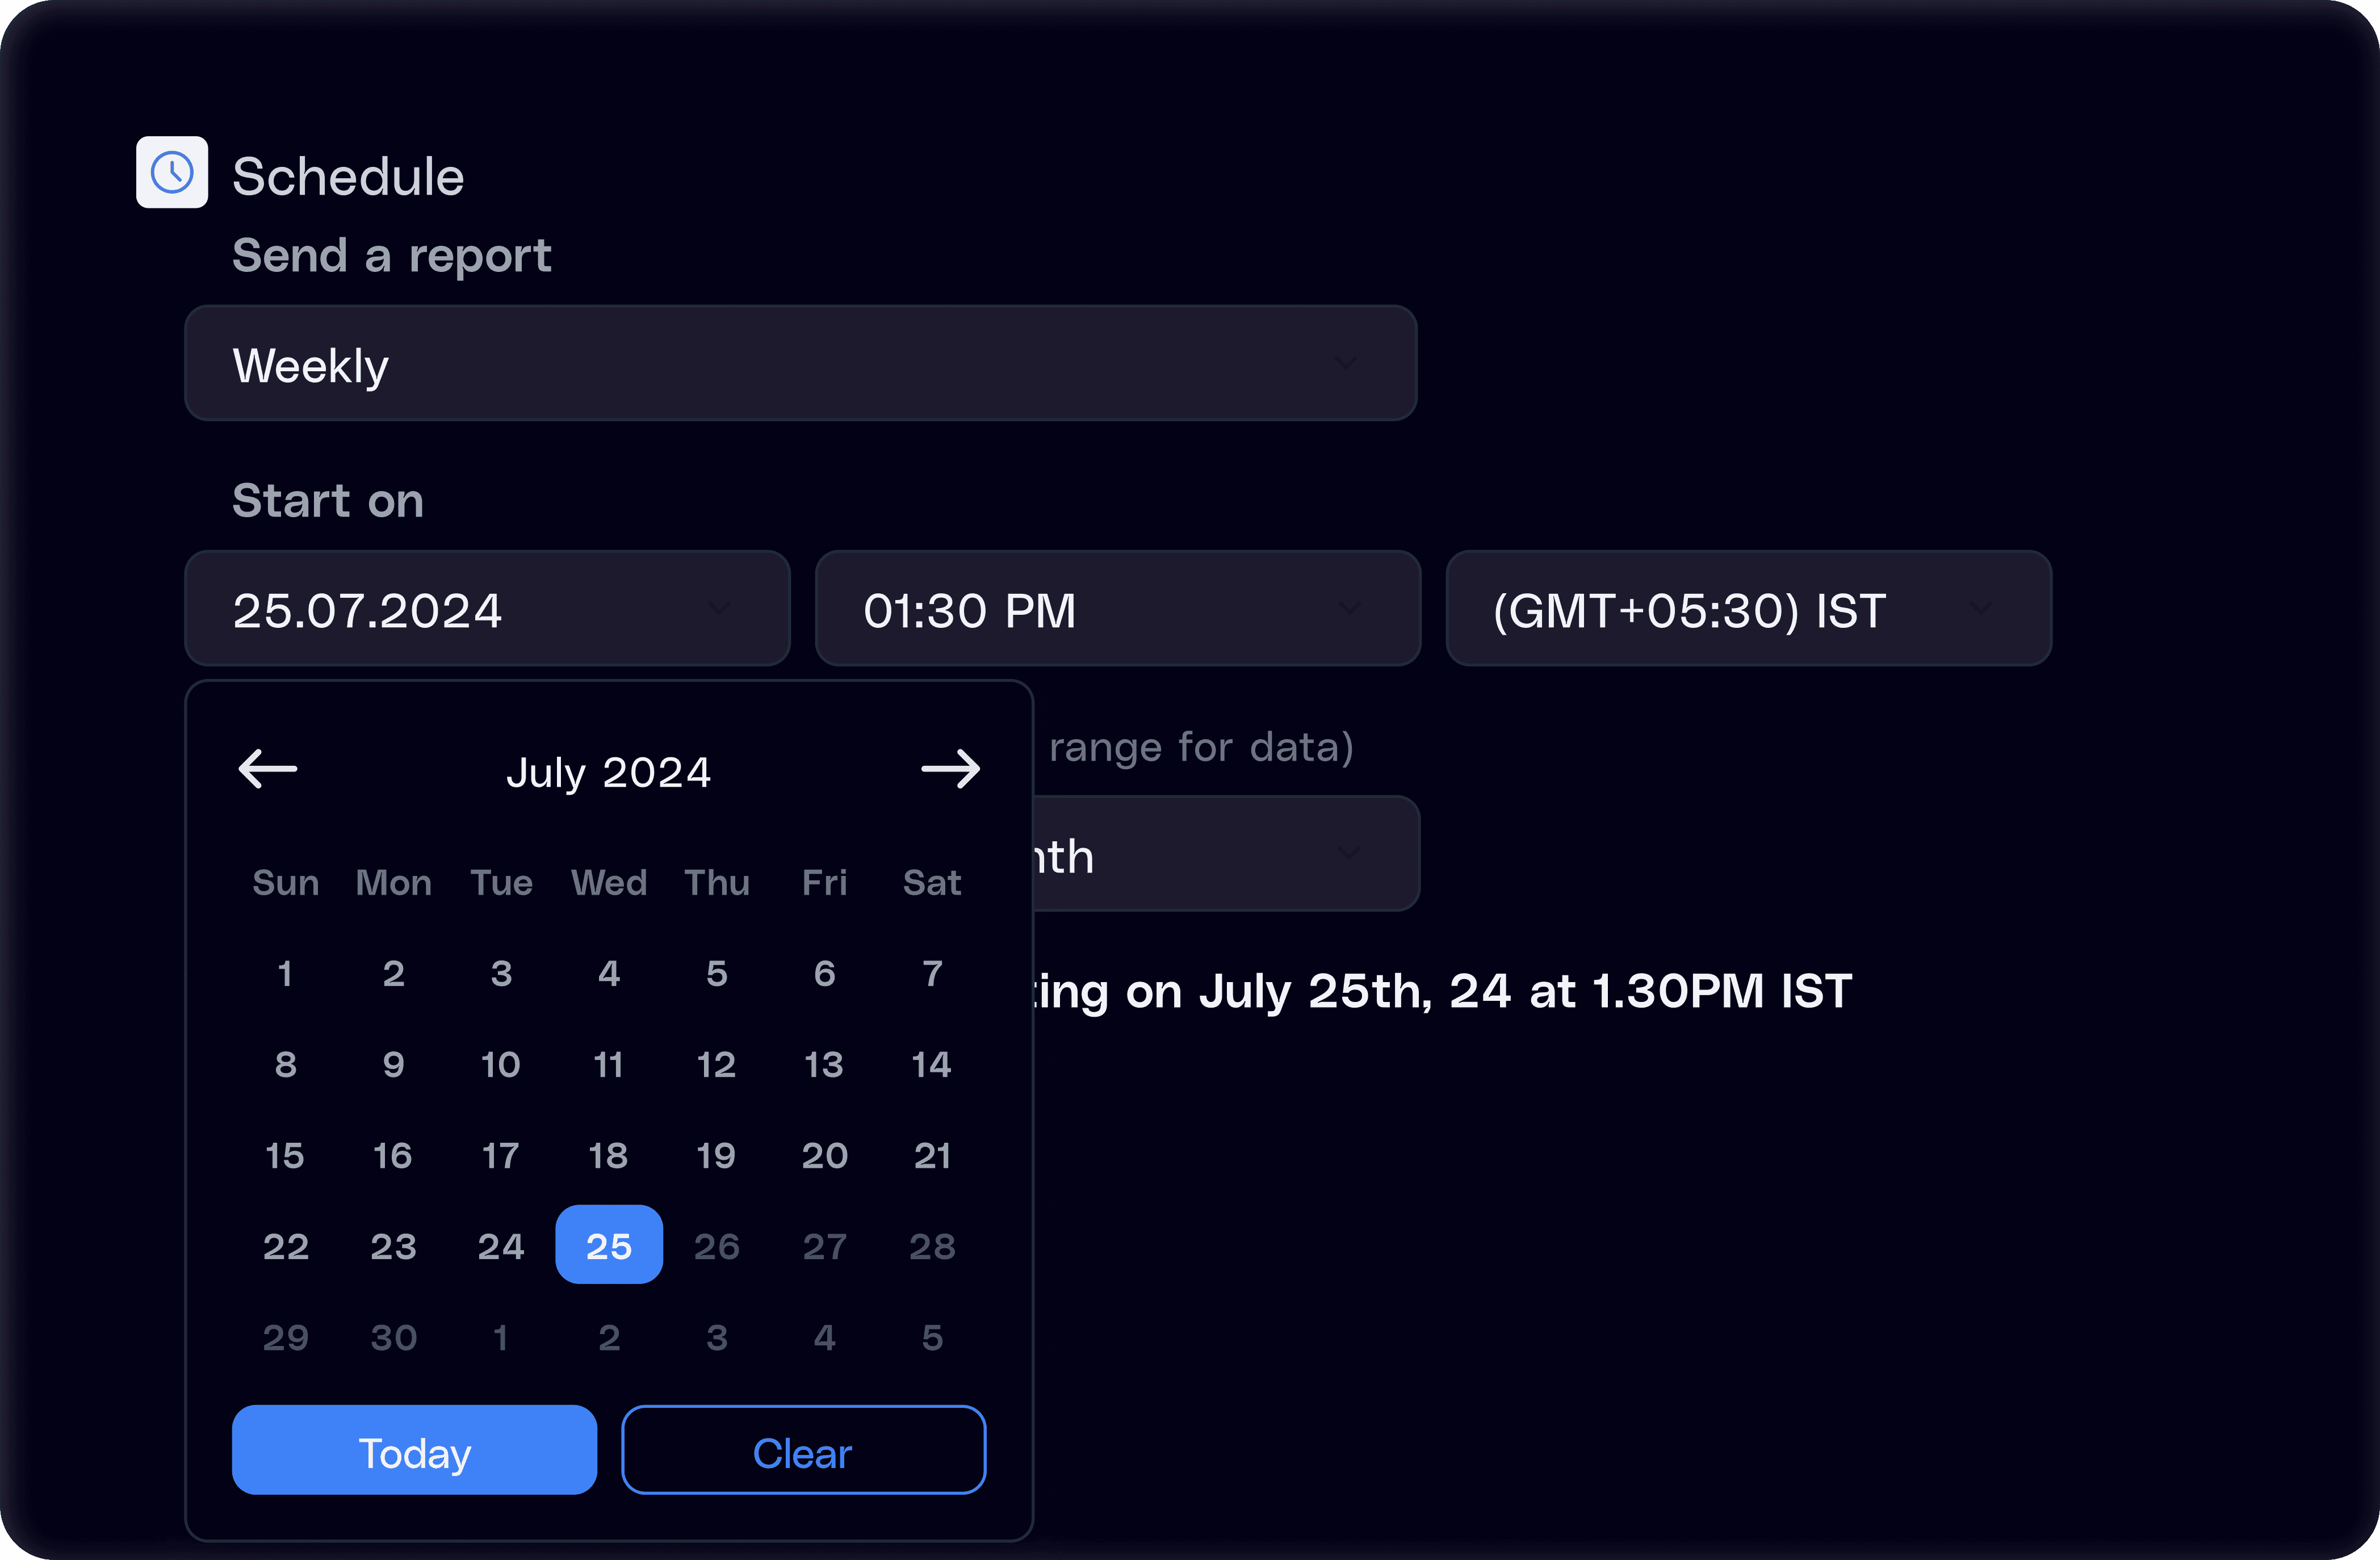

Automated Report Scheduling
Automated Report Scheduling
Automated Report Scheduling
Schedule reports to go out daily, weekly, monthly, or however often you want them to. Automate the sharing of crucial cloud cost information across your organization, across key stakeholders with data that is most relevant to their line of business.
Schedule reports to go out daily, weekly, monthly, or however often you want them to. Automate the sharing of crucial cloud cost information across your organization, across key stakeholders with data that is most relevant to their line of business.
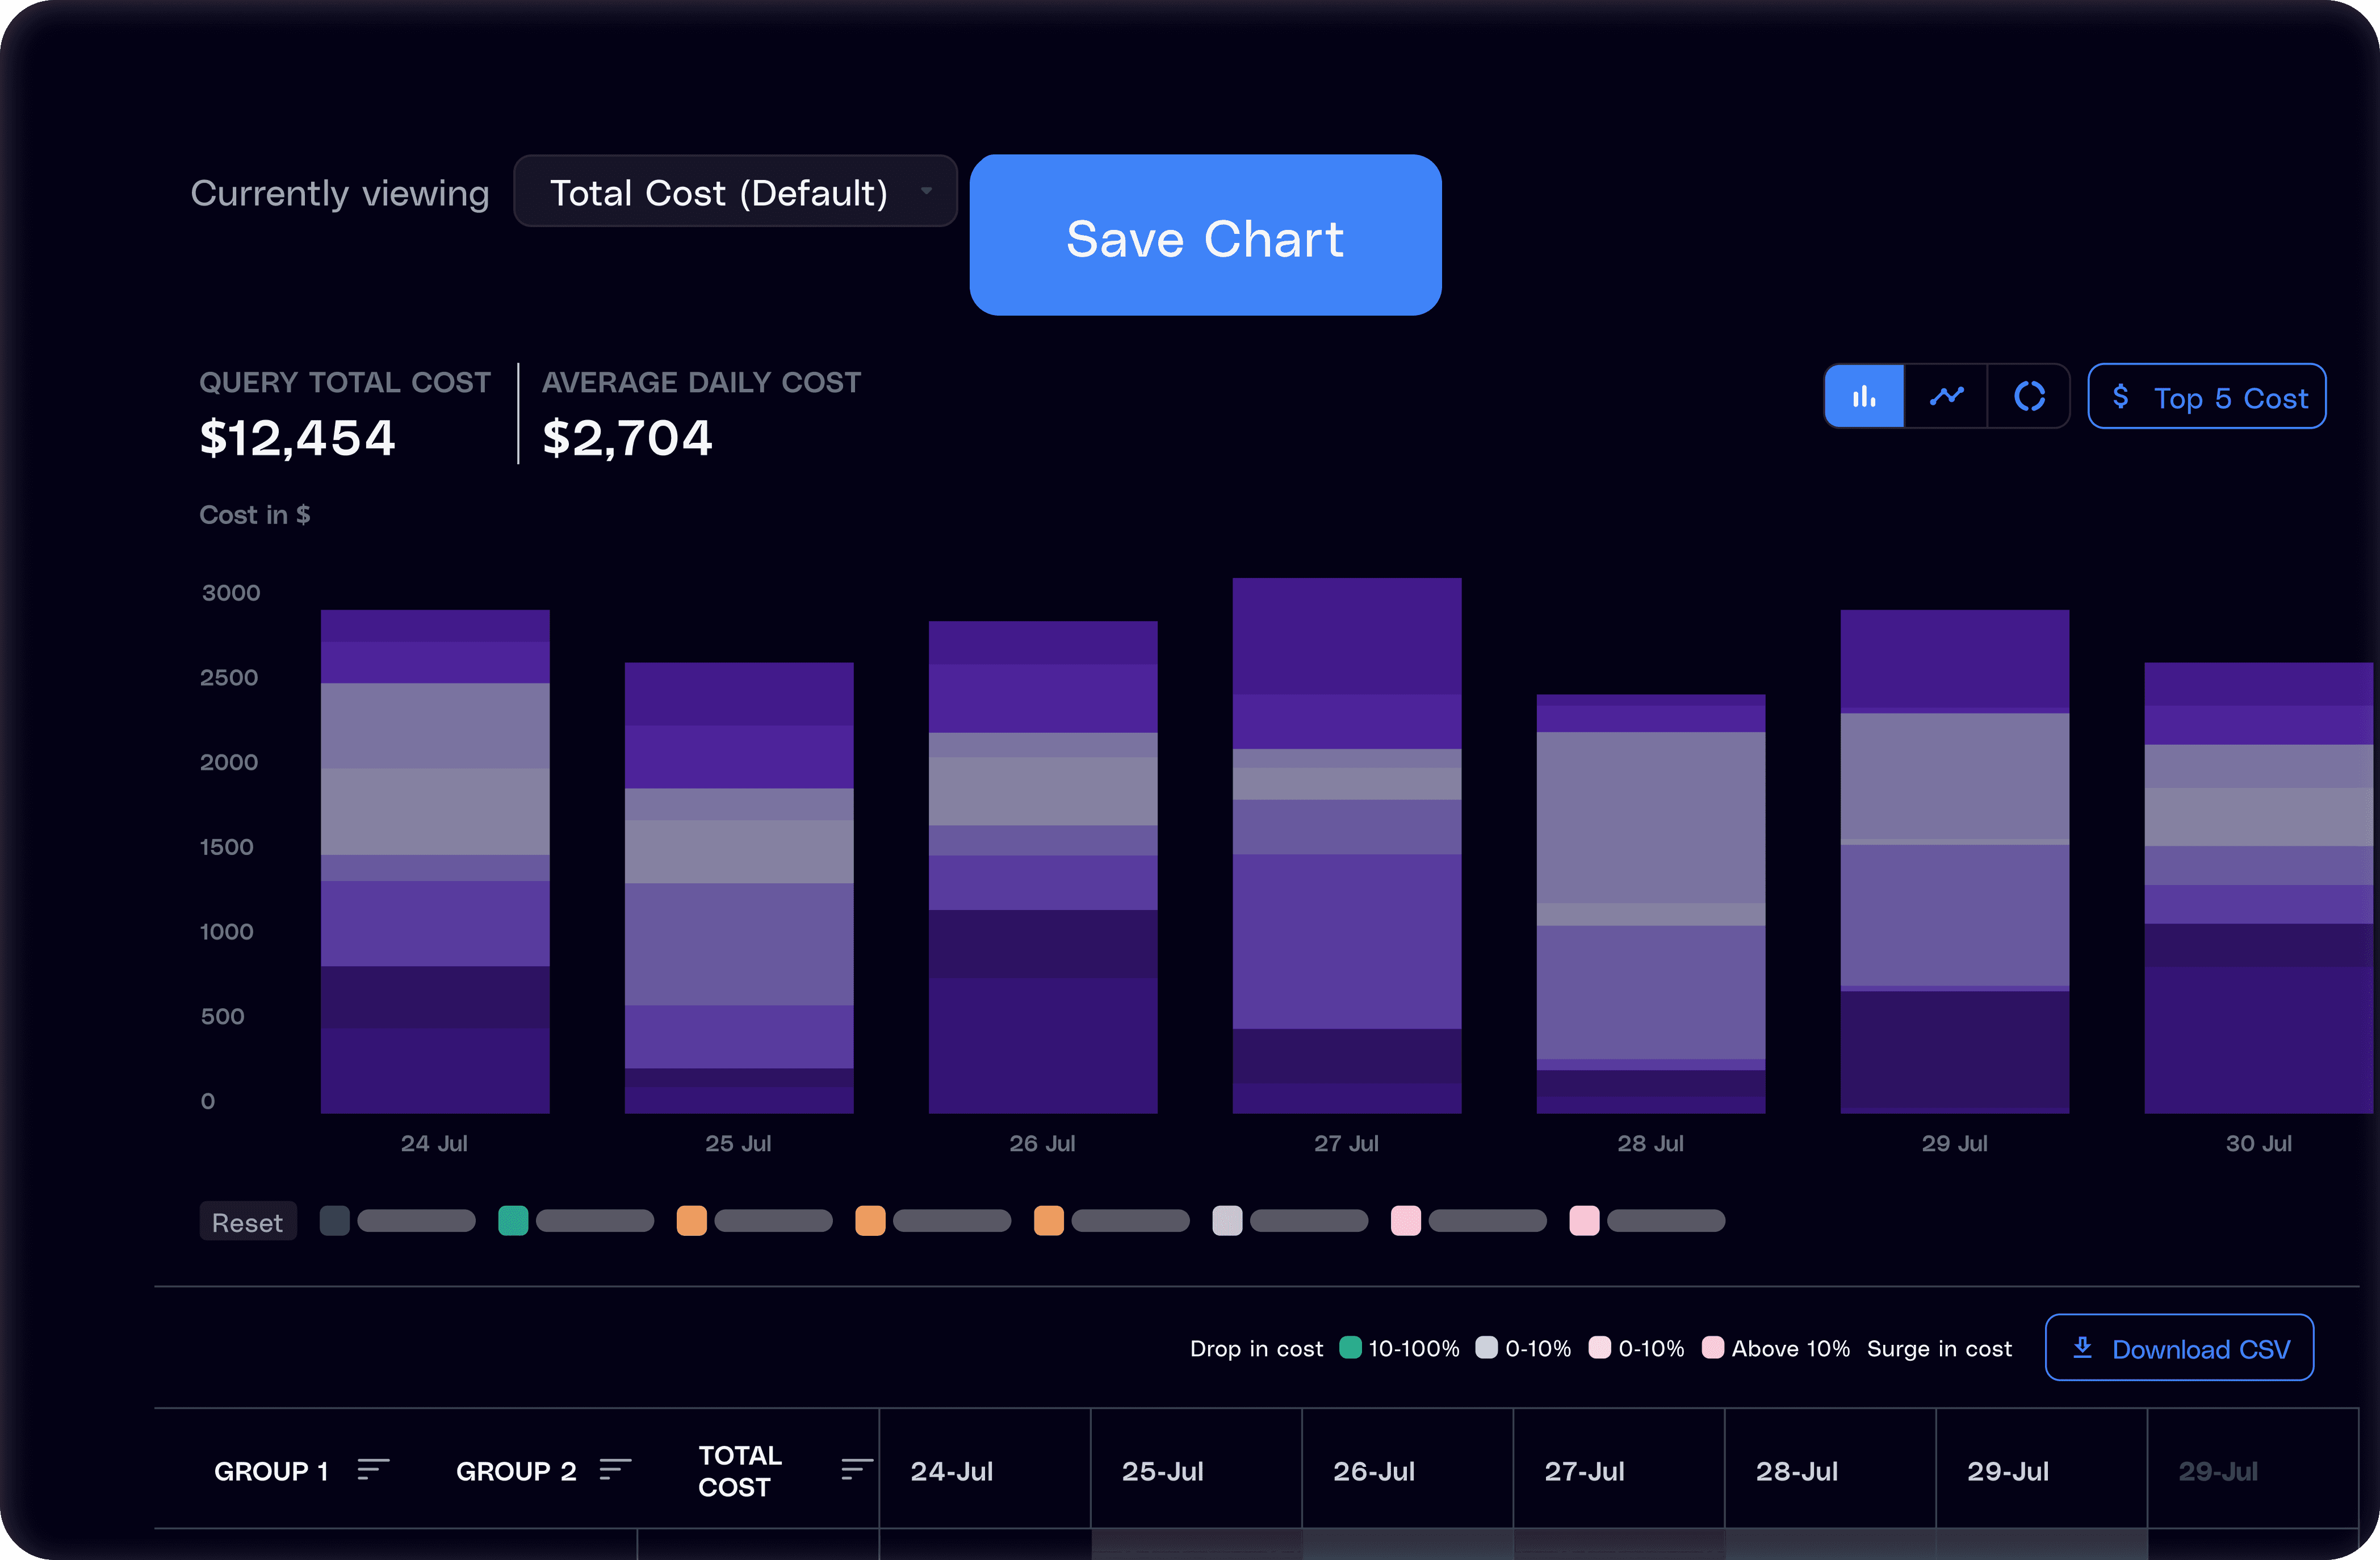

Saveable, Shareable Charts
Saveable, Shareable Charts
Saveable, Shareable Charts
Dashboards and reports can be saved and exported for further analysis and can easily be shared with other stakeholders, periodically over a specific schedule. Automate the sharing of crucial cloud cost information by scheduling reports to go out daily, weekly, monthly, or however often you want them to.
Dashboards and reports can be saved and exported for further analysis and can easily be shared with other stakeholders, periodically over a specific schedule. Automate the sharing of crucial cloud cost information by scheduling reports to go out daily, weekly, monthly, or however often you want them to.
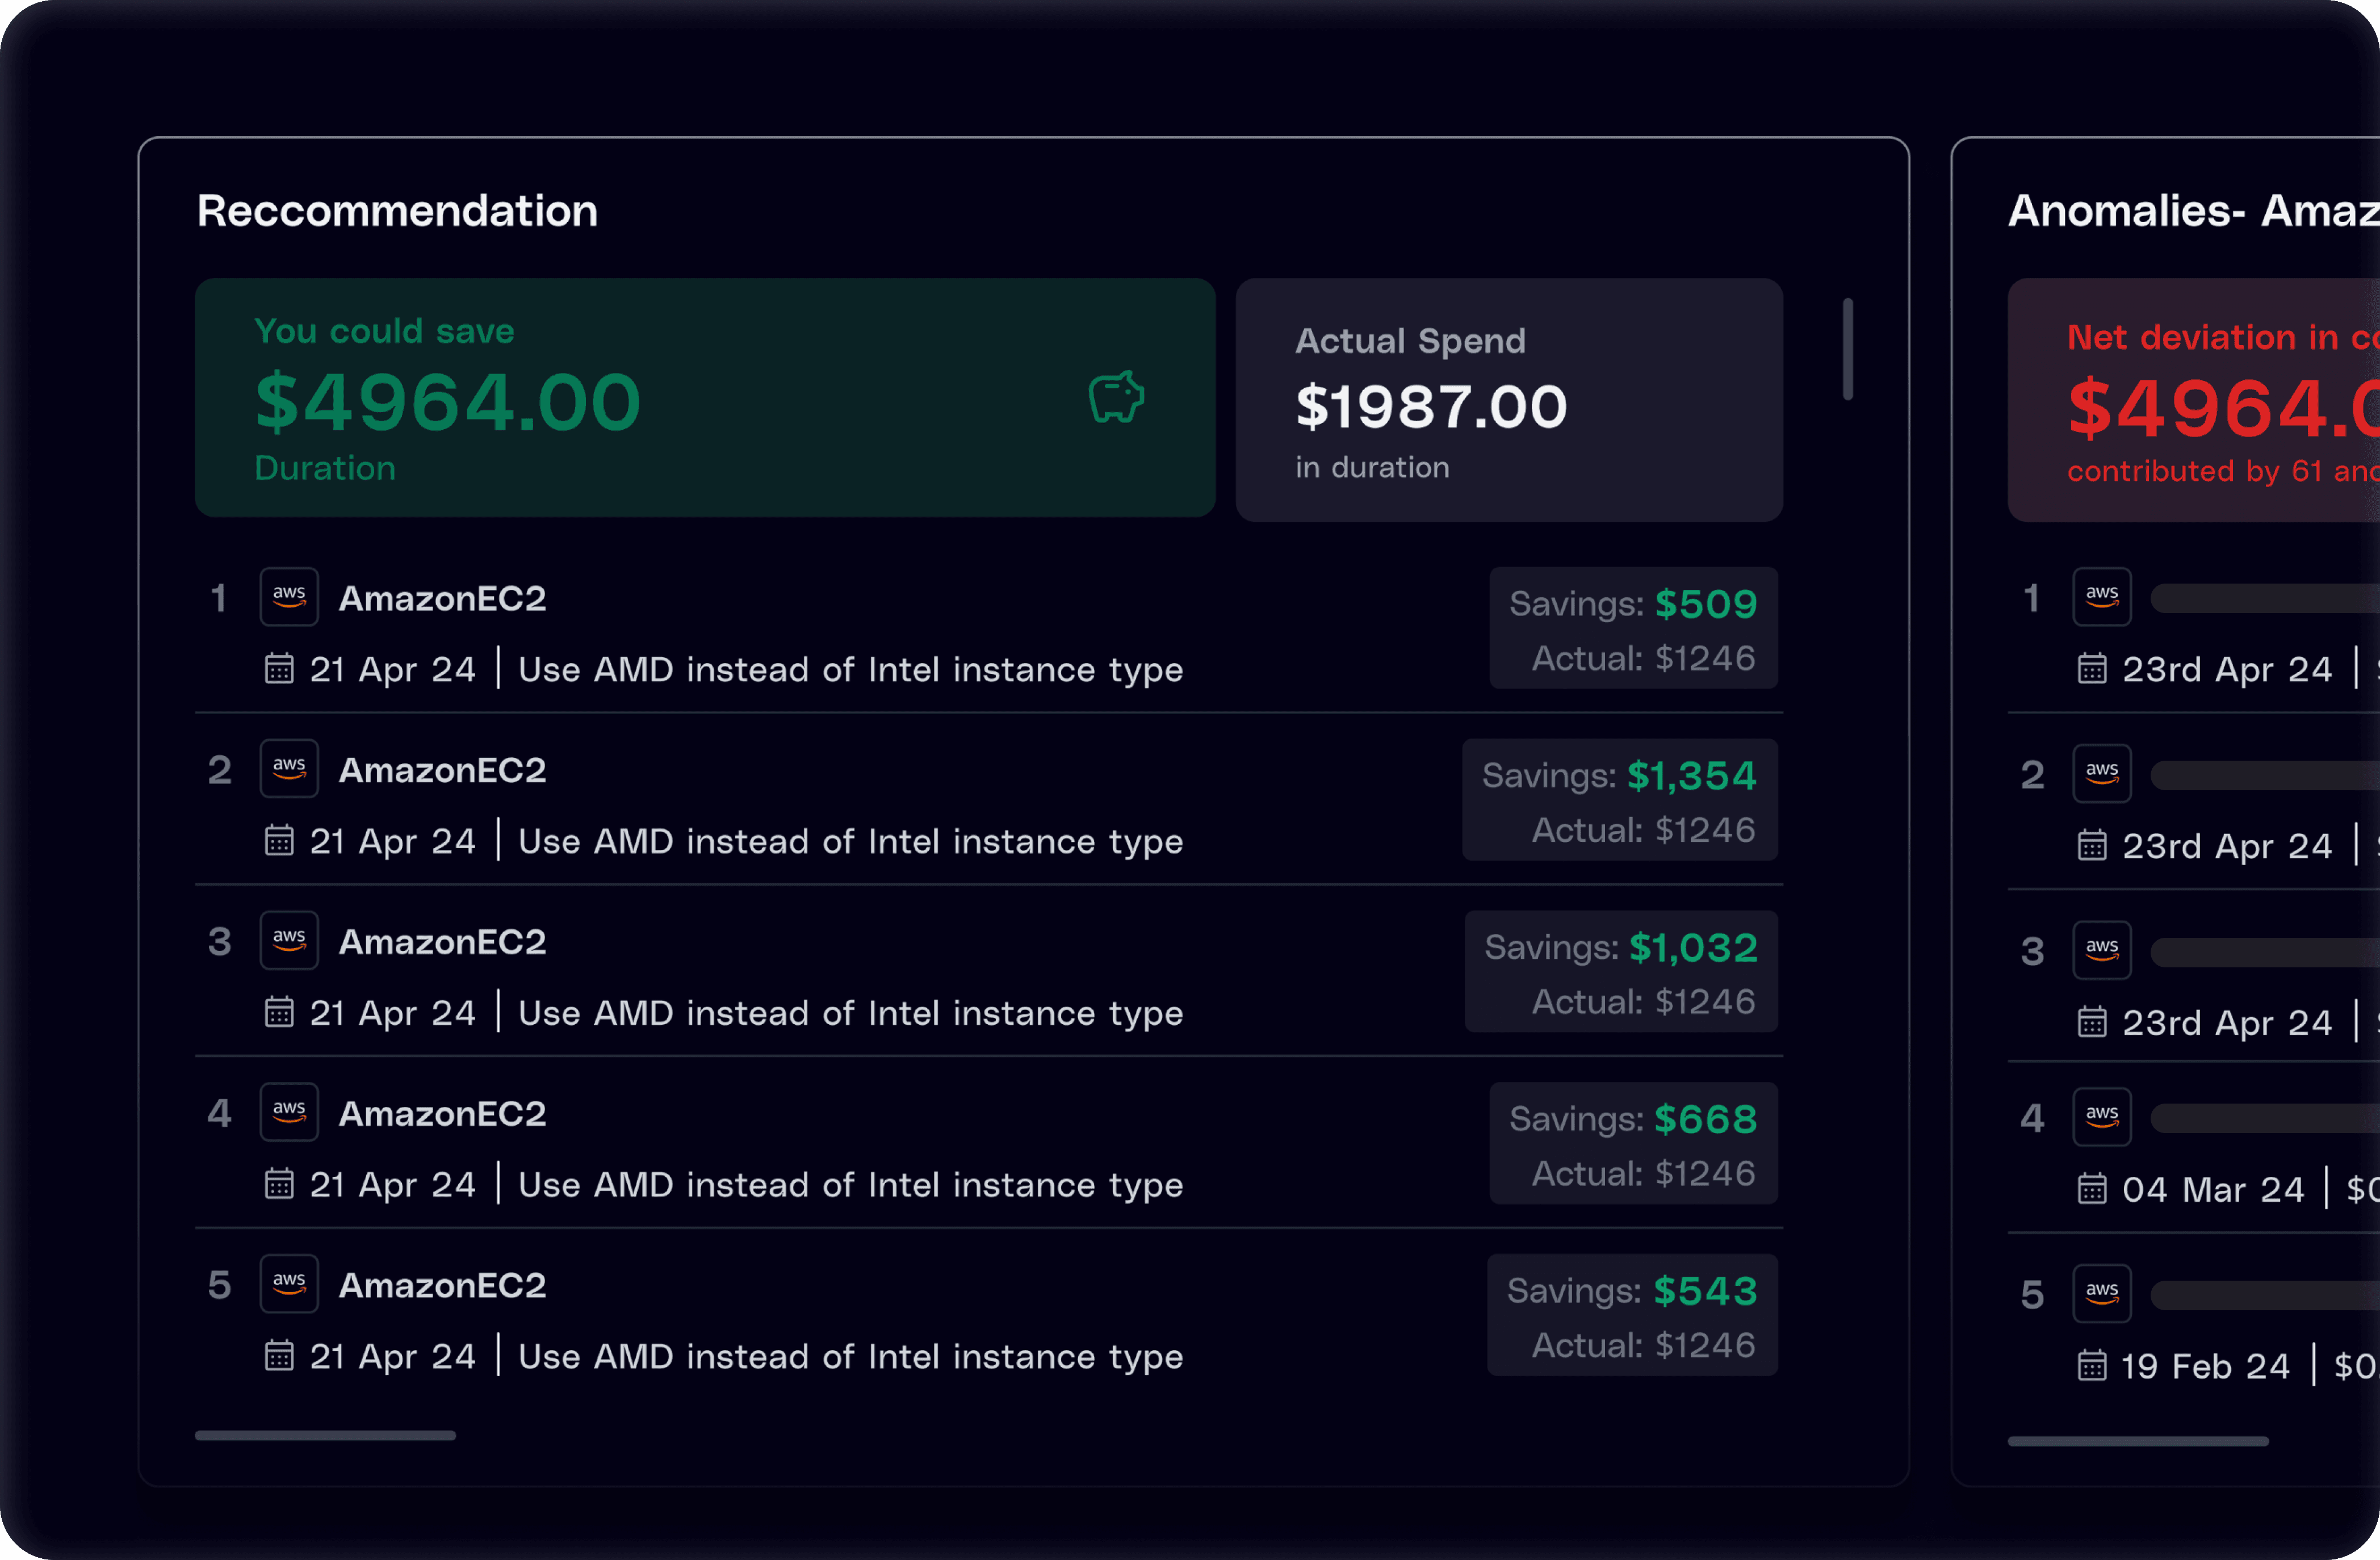

Anomaly & Recommendation views
Anomaly & Recommendation views
Anomaly & Recommendation views
Build your own custom views across specific dimensions based on anomalies and recommendations that Amnic has provided over a specific date range, allowing you to gain a 360 degree view of your cloud cost management efforts.
Build your own custom views across specific dimensions based on anomalies and recommendations that Amnic has provided over a specific date range, allowing you to gain a 360 degree view of your cloud cost management efforts.
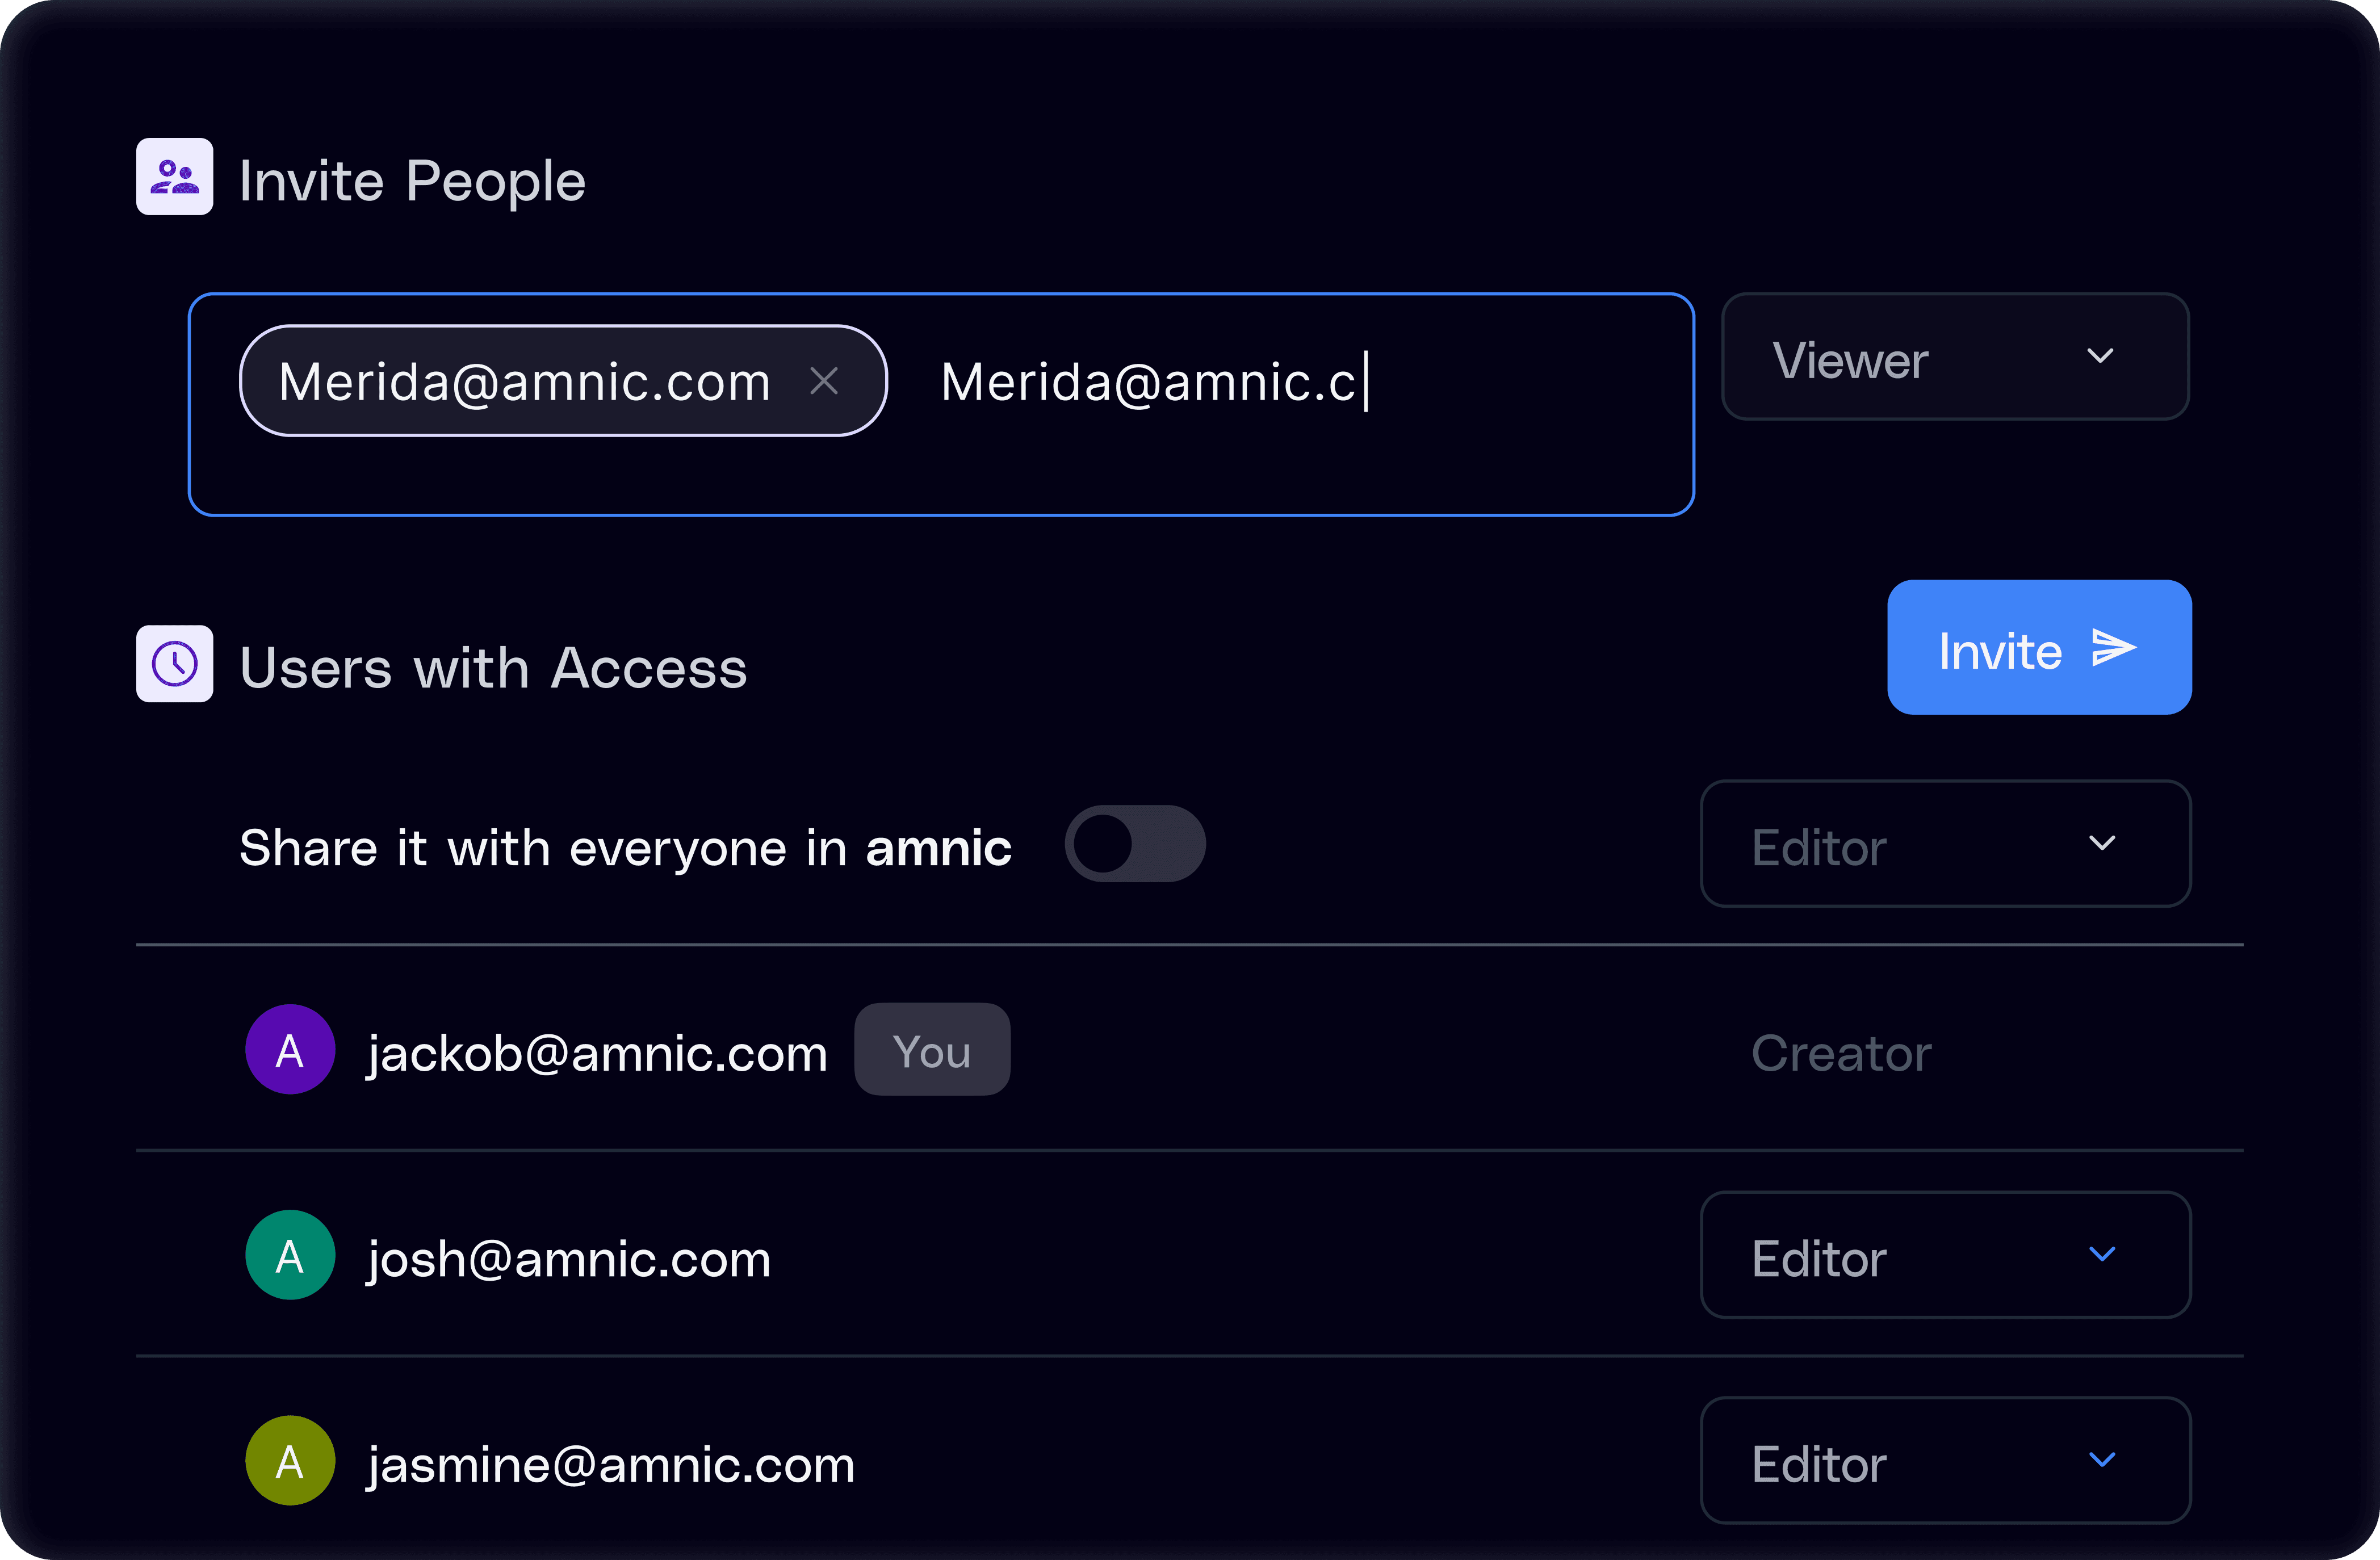

RBAC
RBAC
RBAC
Take control of data sensitivity and bring access to specific roles within the organization depending on levels, to ensure access is provided as required to members of different teams.
Take control of data sensitivity and bring access to specific roles within the organization depending on levels, to ensure access is provided as required to members of different teams.
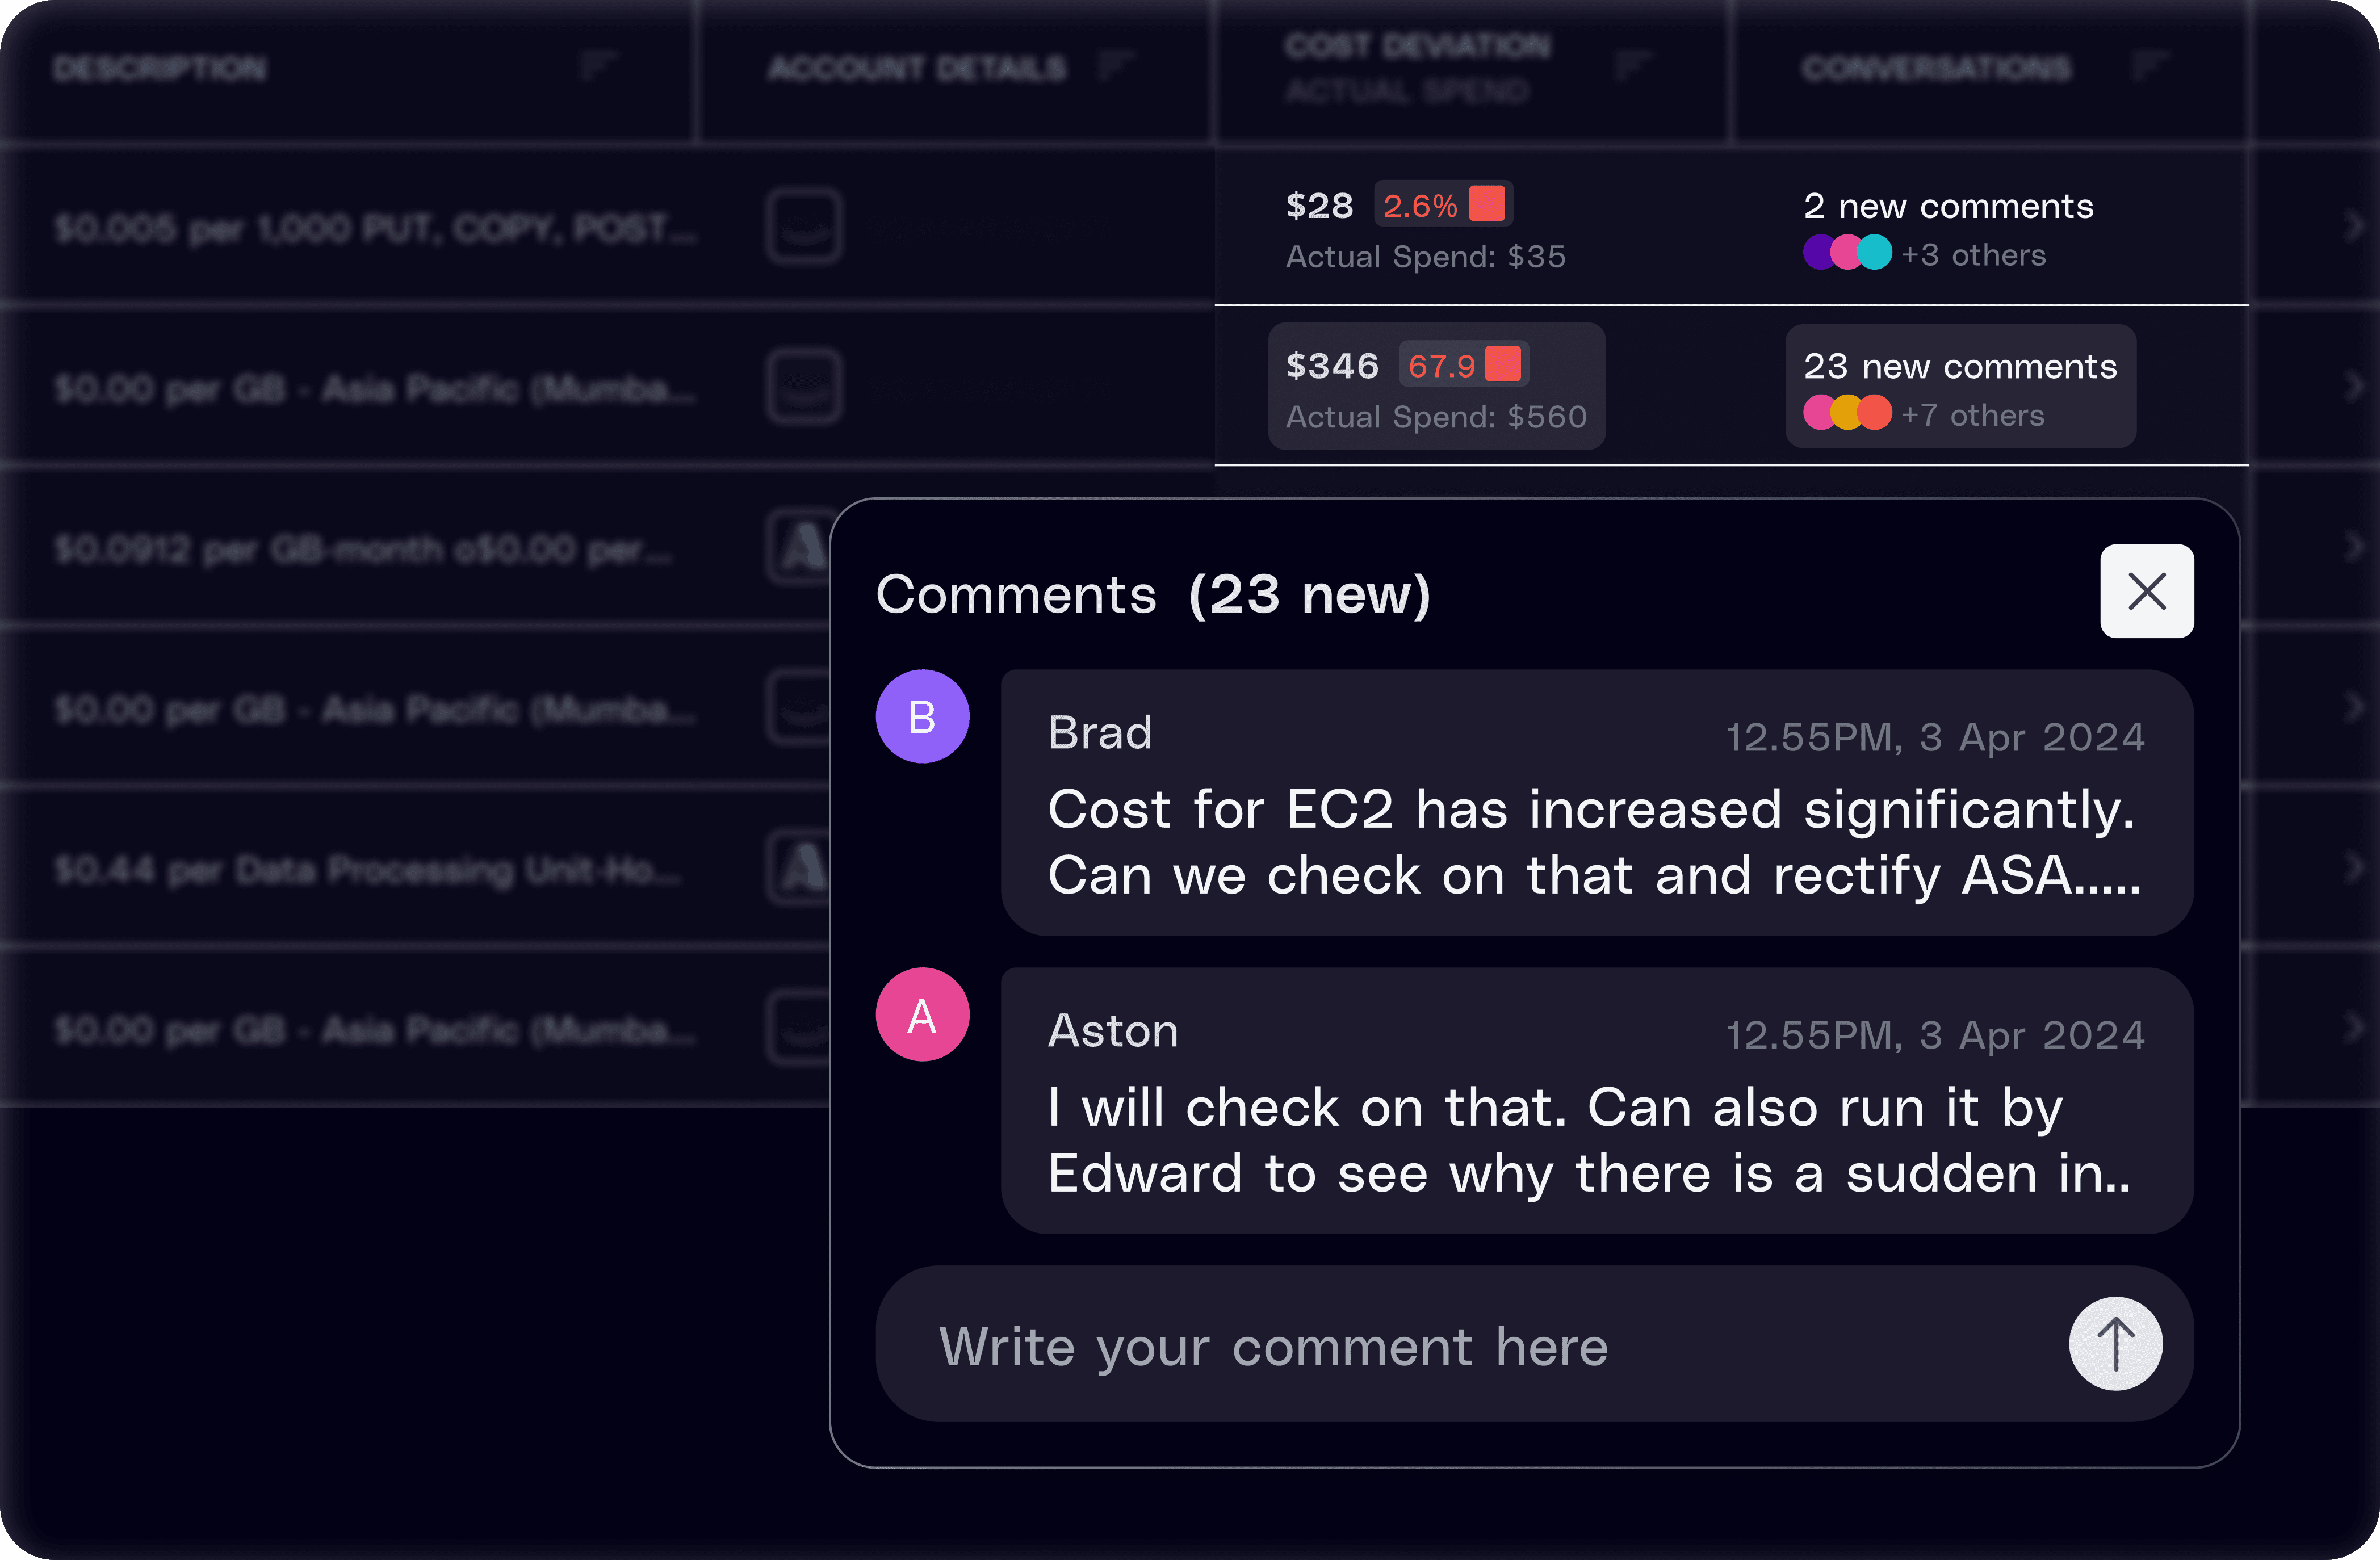

Collaboration
Collaboration
Collaboration
Create notes and annotations to reports that help address relevant comments on cloud and infrastructure. Tag team members to bring attention to them and share the views to work together in identifying areas of high cloud costs.
Create notes and annotations to reports that help address relevant comments on cloud and infrastructure. Tag team members to bring attention to them and share the views to work together in identifying areas of high cloud costs.
Case Study
Coverfox is able to granularize their cloud costs by using Amnic and this has proved instrumental in overcoming the challenges of cloud cost management. By supplementing their efforts on fragmented, Excel-based reporting to a unified platform that offered detailed visualization and actionable insights, Coverfox successfully reduced their cloud expenses and eliminated runaway costs on their infrastructure.
Coverfox is able to granularize their cloud costs by using Amnic and this has proved instrumental in overcoming the challenges of cloud cost management. By supplementing their efforts on fragmented, Excel-based reporting to a unified platform that offered detailed visualization and actionable insights, Coverfox successfully reduced their cloud expenses and eliminated runaway costs on their infrastructure.
Coverfox granularized their cloud costs, overcoming the challenges of cloud cost management. By supplementing their efforts on fragmented, Excel-based reporting to a unified platform that offered detailed visualization and actionable insights, they reduced their cloud expenses and eliminated runaway costs on their infrastructure.
Read More
Customer Testimonial
Customer Testimonial


Piyush Ranjan
Coverfox
“Working with Amnic, we found a way to build and save reports that are relevant to our teams on a daily basis. It simplified our comprehension of the overall costs associated with data and compute in a manner that we were able to take actionable measures that put us back in control of our cloud spend, across cloud providers.”
Blogs
Customers
Team Amnic at AWS re:Invent 2024
Dec 16, 2024

What Businesses Can Do to Control Runaway Cloud Spend
Nov 28, 2024
Why Cost Visualization Is Imperative to Monitor Your Cloud Spend?
Nov 20, 2024

Amnic is Excited to See You at KubeCon!
Nov 7, 2024

Meet Us at FinOps X Europe, 2024
Nov 7, 2024

Decoding the FinOps Framework
Oct 23, 2024

Experience Amnic's Enhanced Custom Views Feature
Oct 15, 2024

The 3 Pillars of Cloud Cost Observability: Visualization, Control & Management
Oct 8, 2024
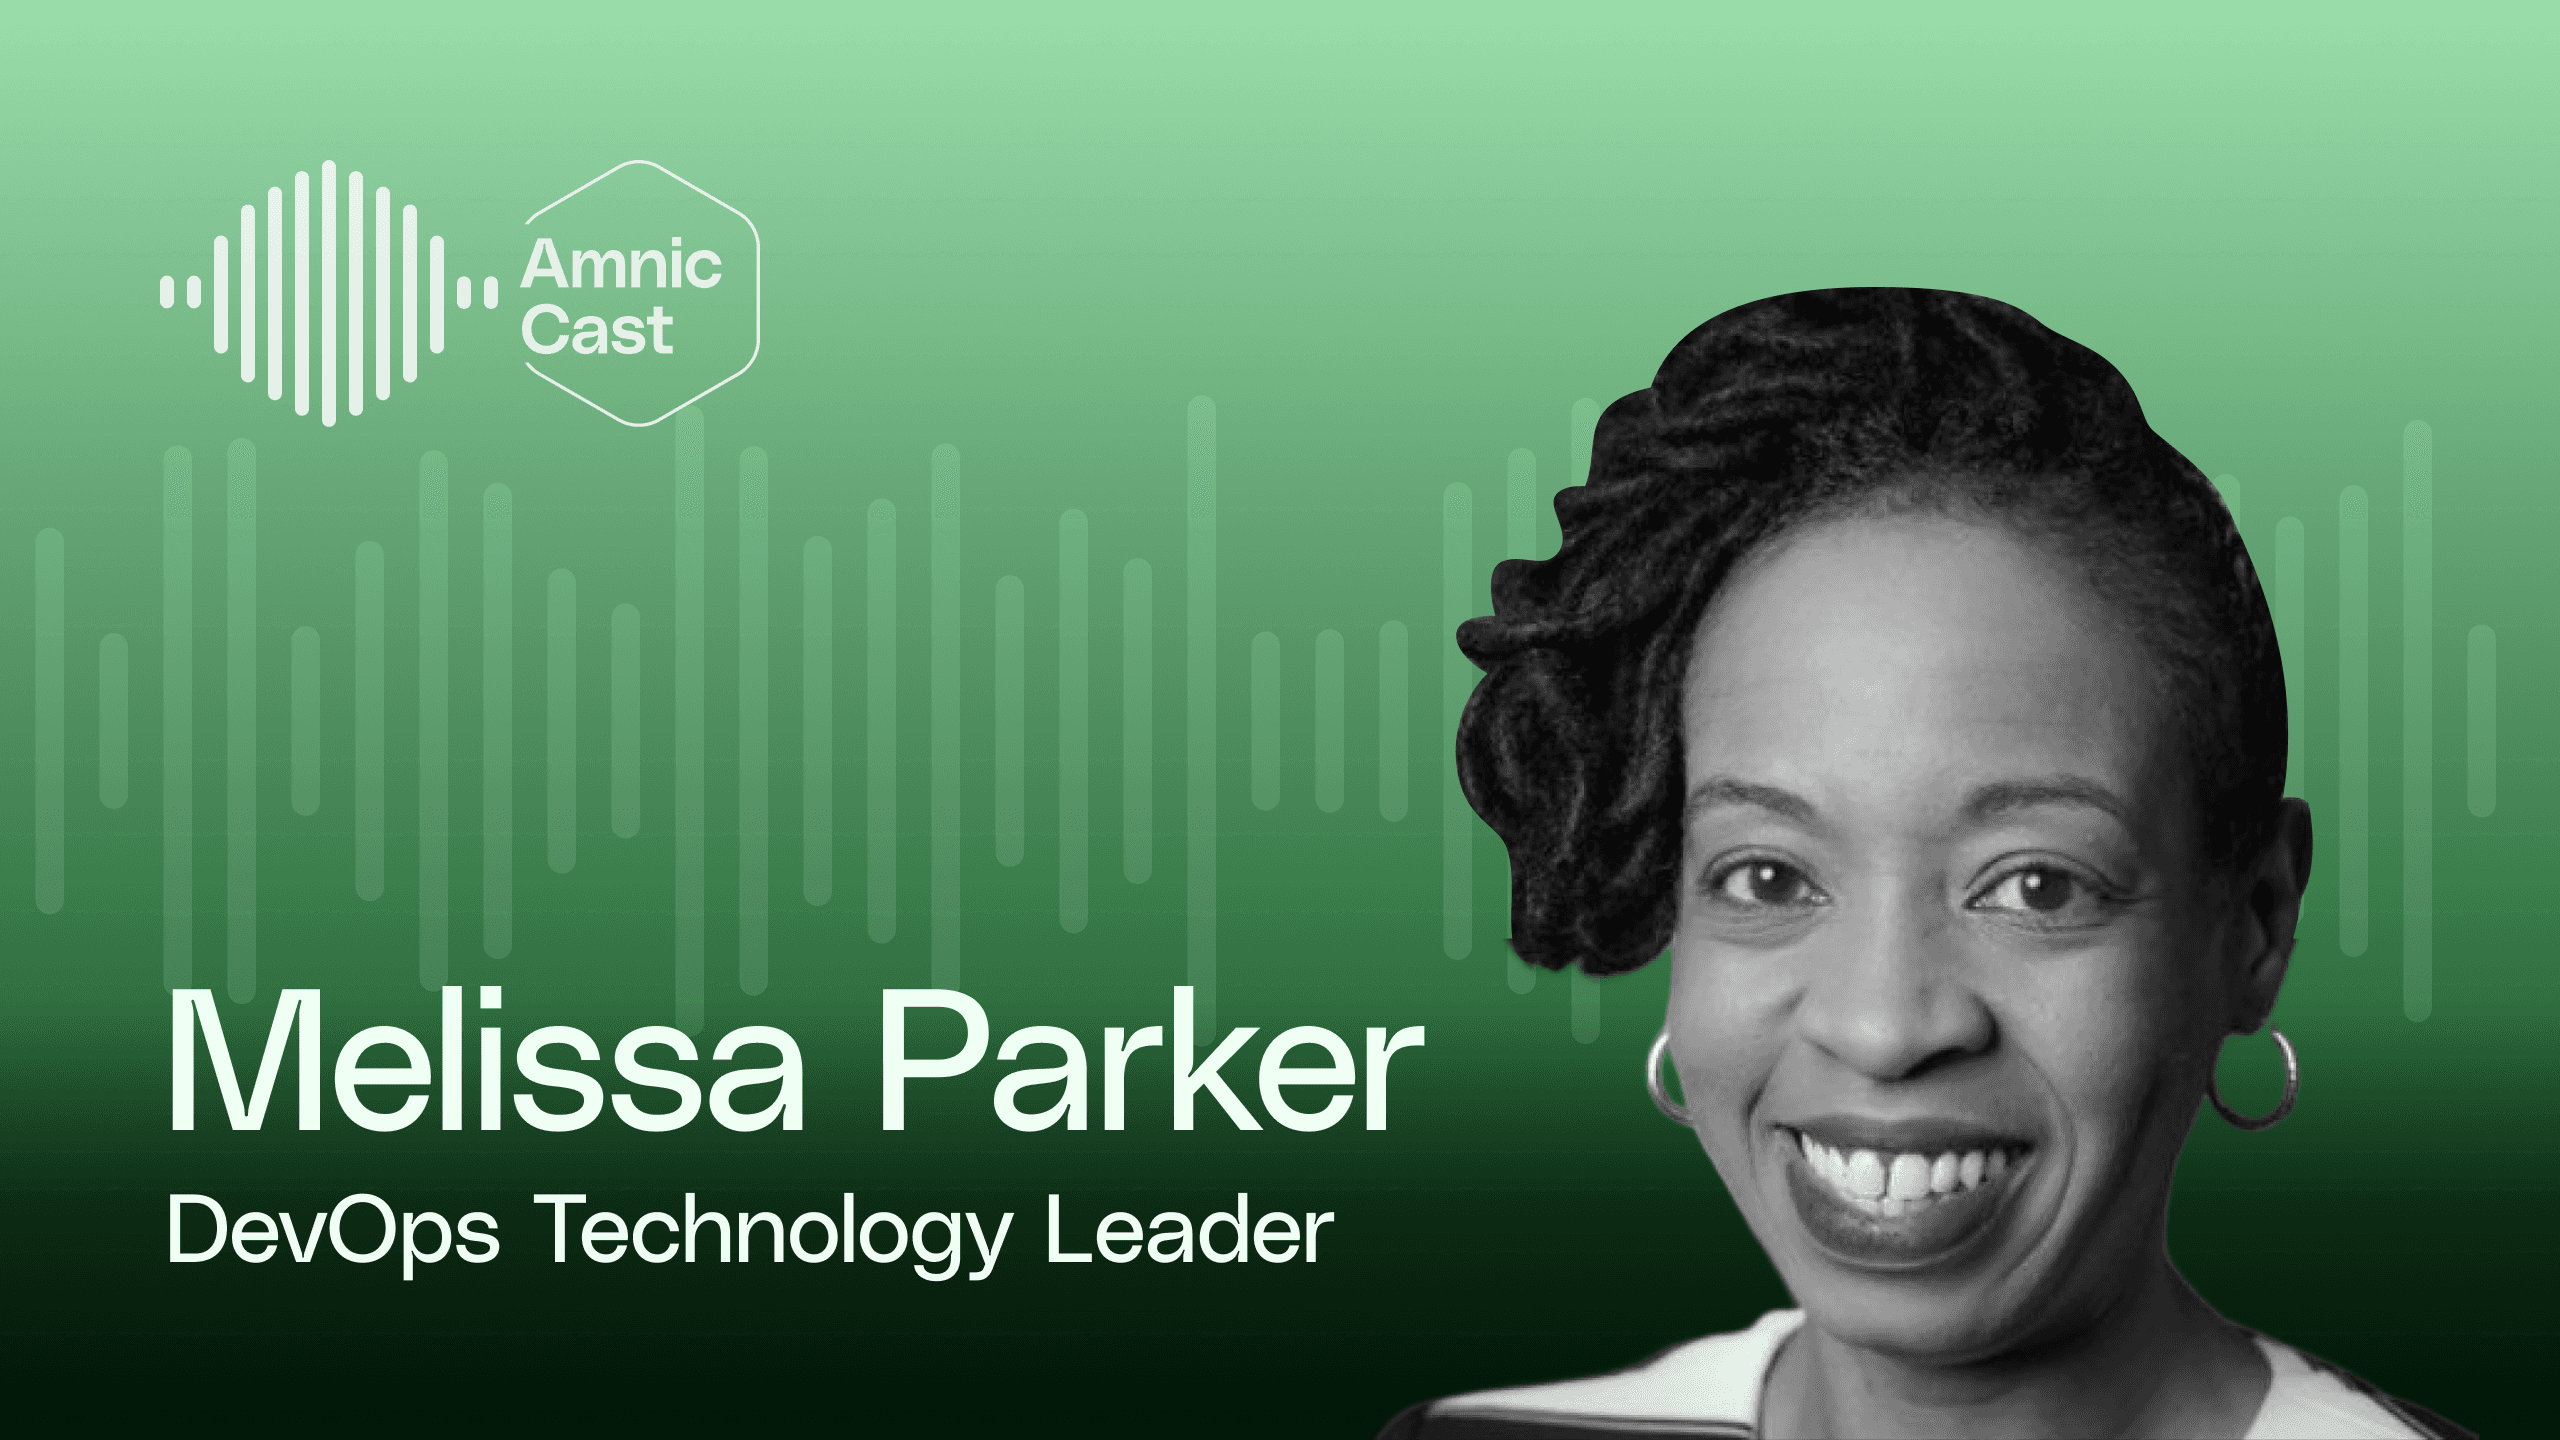
AmnicCast with Melissa Parker
Oct 3, 2024

AmnicCast with Satender Patwal
Sep 27, 2024

Understanding Amnic’s Latest Feature: RBAC for Custom Views
Sep 25, 2024

Top 10 Cloud Cost Observability Metrics to Watch
Sep 20, 2024

How to Use AWS Cost Allocation Tags
Sep 10, 2024

The 20 Best FinOps Memes to Make You Chuckle
Sep 4, 2024

Best Practices for Automated Cloud Cost Reporting
Aug 28, 2024
Top 5 Strategies for Managing Cloud Costs
Aug 13, 2024

Managing Lean Infrastructure in the Era of Generative AI
Aug 7, 2024
What Are Common FinOps Roles and Responsibilities?
Aug 1, 2024

Using Cloud Cost Management to Improve DORA Metrics
Jul 25, 2024

How to Properly Provision Kubernetes Resources
Jul 18, 2024

Introducing Amnic’s All New Cost Analyzer
Jul 15, 2024

AmnicCast with Ankur Khare
Jul 10, 2024

How to Mitigate Cloud Cost Surges in AWS
Jul 10, 2024

AmnicCast with Smita Ohja
Jul 2, 2024

Shifting Left: Cloud Cost Observability for DevOps
Jun 18, 2024

Things you should know about cloud cost optimization in 2024
Jun 10, 2024

Demystifying Cloud Cost Observability
May 31, 2024

How Amnic Brought Cloud Cost Observability to Center Stage at AWS Summit
May 16, 2024

What a well optimized Kubernetes looks like
Apr 17, 2024

What is K8s Cost Observability and how to achieve it
Apr 4, 2024

What is Cloud Cost Management?
Mar 4, 2024

Everything you need to know about AWS EC2 Pricing in 2024
Feb 12, 2024

The Ultimate EKS Cost Optimization Guide for 2024
Feb 7, 2024

Understanding FOCUS™ for Beginners
Jan 30, 2024

What is Cloud Cost Observability?
Jan 19, 2024

Cloud Cost Management Strategies 2024
Jan 17, 2024

How to implement FinOps in your Organization
Jan 10, 2024

AKS Pricing & Cost Optimization
Dec 11, 2023

EKS Pricing and How to Optimize your costs
Dec 10, 2023

Decoding the Storage Cost Tiers For Azure
Dec 7, 2023

Breaking down Storage Cost Tiers For GCP
Dec 5, 2023

Running predictable and cost-optimized workloads on GKE
Dec 3, 2023

Cost Optimization on Azure
Nov 30, 2023

Optimizing Pricing on Google Cloud
Nov 27, 2023

Simplifying Data Transfer Costs across AWS
Nov 24, 2023

A guide to navigating AWS Storage Costs
Nov 16, 2023

What is Internal Developer Platform (IDP) ?
Aug 25, 2023

Unlocking Full Potential of AWS with Karpenter-2
Aug 9, 2023

Unlocking Full Potential of AWS with Karpenter-1
Jul 31, 2023

Building Blocks | May 2023
May 3, 2023

Building Blocks | April 2023
Apr 6, 2023

Building Blocks | March 2023
Mar 1, 2023

Prometheus and Grafana: Observability stack in K8s
Feb 2, 2023

Building Blocks | February 2023
Feb 1, 2023

Building a Kubernetes CRD
Jan 12, 2023

Building Blocks | January 2023
Jan 5, 2023

Building Blocks | December 2022
Dec 22, 2022

Team Amnic at AWS re:Invent 2024
Dec 16, 2024

What Businesses Can Do to Control Runaway Cloud Spend
Nov 28, 2024

Why Cost Visualization Is Imperative to Monitor Your Cloud Spend?
Nov 20, 2024

Amnic is Excited to See You at KubeCon!
Nov 7, 2024

Meet Us at FinOps X Europe, 2024
Nov 7, 2024

Decoding the FinOps Framework
Oct 23, 2024

Experience Amnic's Enhanced Custom Views Feature
Oct 15, 2024

The 3 Pillars of Cloud Cost Observability: Visualization, Control & Management
Oct 8, 2024

AmnicCast with Melissa Parker
Oct 3, 2024

AmnicCast with Satender Patwal
Sep 27, 2024

Understanding Amnic’s Latest Feature: RBAC for Custom Views
Sep 25, 2024

Top 10 Cloud Cost Observability Metrics to Watch
Sep 20, 2024

How to Use AWS Cost Allocation Tags
Sep 10, 2024

The 20 Best FinOps Memes to Make You Chuckle
Sep 4, 2024

Best Practices for Automated Cloud Cost Reporting
Aug 28, 2024

Top 5 Strategies for Managing Cloud Costs
Aug 13, 2024

Managing Lean Infrastructure in the Era of Generative AI
Aug 7, 2024

What Are Common FinOps Roles and Responsibilities?
Aug 1, 2024

Using Cloud Cost Management to Improve DORA Metrics
Jul 25, 2024

How to Properly Provision Kubernetes Resources
Jul 18, 2024

Introducing Amnic’s All New Cost Analyzer
Jul 15, 2024

AmnicCast with Ankur Khare
Jul 10, 2024

How to Mitigate Cloud Cost Surges in AWS
Jul 10, 2024

AmnicCast with Smita Ohja
Jul 2, 2024

Shifting Left: Cloud Cost Observability for DevOps
Jun 18, 2024

Things you should know about cloud cost optimization in 2024
Jun 10, 2024

Demystifying Cloud Cost Observability
May 31, 2024

How Amnic Brought Cloud Cost Observability to Center Stage at AWS Summit
May 16, 2024

What a well optimized Kubernetes looks like
Apr 17, 2024

What is K8s Cost Observability and how to achieve it
Apr 4, 2024

What is Cloud Cost Management?
Mar 4, 2024

Everything you need to know about AWS EC2 Pricing in 2024
Feb 12, 2024

The Ultimate EKS Cost Optimization Guide for 2024
Feb 7, 2024

Understanding FOCUS™ for Beginners
Jan 30, 2024

What is Cloud Cost Observability?
Jan 19, 2024

Cloud Cost Management Strategies 2024
Jan 17, 2024

How to implement FinOps in your Organization
Jan 10, 2024

AKS Pricing & Cost Optimization
Dec 11, 2023

EKS Pricing and How to Optimize your costs
Dec 10, 2023

Decoding the Storage Cost Tiers For Azure
Dec 7, 2023

Breaking down Storage Cost Tiers For GCP
Dec 5, 2023

Running predictable and cost-optimized workloads on GKE
Dec 3, 2023

Cost Optimization on Azure
Nov 30, 2023

Optimizing Pricing on Google Cloud
Nov 27, 2023

Simplifying Data Transfer Costs across AWS
Nov 24, 2023

A guide to navigating AWS Storage Costs
Nov 16, 2023

What is Internal Developer Platform (IDP) ?
Aug 25, 2023

Unlocking Full Potential of AWS with Karpenter-2
Aug 9, 2023

Unlocking Full Potential of AWS with Karpenter-1
Jul 31, 2023

Building Blocks | May 2023
May 3, 2023

Building Blocks | April 2023
Apr 6, 2023

Building Blocks | March 2023
Mar 1, 2023

Prometheus and Grafana: Observability stack in K8s
Feb 2, 2023

Building Blocks | February 2023
Feb 1, 2023

Building a Kubernetes CRD
Jan 12, 2023

Building Blocks | January 2023
Jan 5, 2023

Building Blocks | December 2022
Dec 22, 2022
Blogs
Customers

Team Amnic at AWS re:Invent 2024
Dec 16, 2024

What Businesses Can Do to Control Runaway Cloud Spend
Nov 28, 2024

Why Cost Visualization Is Imperative to Monitor Your Cloud Spend?
Nov 20, 2024

Amnic is Excited to See You at KubeCon!
Nov 7, 2024

Meet Us at FinOps X Europe, 2024
Nov 7, 2024

Decoding the FinOps Framework
Oct 23, 2024

Experience Amnic's Enhanced Custom Views Feature
Oct 15, 2024

The 3 Pillars of Cloud Cost Observability: Visualization, Control & Management
Oct 8, 2024

AmnicCast with Melissa Parker
Oct 3, 2024

AmnicCast with Satender Patwal
Sep 27, 2024

Understanding Amnic’s Latest Feature: RBAC for Custom Views
Sep 25, 2024

Top 10 Cloud Cost Observability Metrics to Watch
Sep 20, 2024

How to Use AWS Cost Allocation Tags
Sep 10, 2024

The 20 Best FinOps Memes to Make You Chuckle
Sep 4, 2024

Best Practices for Automated Cloud Cost Reporting
Aug 28, 2024

Top 5 Strategies for Managing Cloud Costs
Aug 13, 2024

Managing Lean Infrastructure in the Era of Generative AI
Aug 7, 2024

What Are Common FinOps Roles and Responsibilities?
Aug 1, 2024

Using Cloud Cost Management to Improve DORA Metrics
Jul 25, 2024

How to Properly Provision Kubernetes Resources
Jul 18, 2024

Introducing Amnic’s All New Cost Analyzer
Jul 15, 2024

AmnicCast with Ankur Khare
Jul 10, 2024

How to Mitigate Cloud Cost Surges in AWS
Jul 10, 2024

AmnicCast with Smita Ohja
Jul 2, 2024

Shifting Left: Cloud Cost Observability for DevOps
Jun 18, 2024

Things you should know about cloud cost optimization in 2024
Jun 10, 2024

Demystifying Cloud Cost Observability
May 31, 2024

How Amnic Brought Cloud Cost Observability to Center Stage at AWS Summit
May 16, 2024

What a well optimized Kubernetes looks like
Apr 17, 2024

What is K8s Cost Observability and how to achieve it
Apr 4, 2024

What is Cloud Cost Management?
Mar 4, 2024

Everything you need to know about AWS EC2 Pricing in 2024
Feb 12, 2024

The Ultimate EKS Cost Optimization Guide for 2024
Feb 7, 2024

Understanding FOCUS™ for Beginners
Jan 30, 2024

What is Cloud Cost Observability?
Jan 19, 2024

Cloud Cost Management Strategies 2024
Jan 17, 2024

How to implement FinOps in your Organization
Jan 10, 2024

AKS Pricing & Cost Optimization
Dec 11, 2023

EKS Pricing and How to Optimize your costs
Dec 10, 2023

Decoding the Storage Cost Tiers For Azure
Dec 7, 2023

Breaking down Storage Cost Tiers For GCP
Dec 5, 2023

Running predictable and cost-optimized workloads on GKE
Dec 3, 2023

Cost Optimization on Azure
Nov 30, 2023

Optimizing Pricing on Google Cloud
Nov 27, 2023

Simplifying Data Transfer Costs across AWS
Nov 24, 2023

A guide to navigating AWS Storage Costs
Nov 16, 2023

What is Internal Developer Platform (IDP) ?
Aug 25, 2023

Unlocking Full Potential of AWS with Karpenter-2
Aug 9, 2023

Unlocking Full Potential of AWS with Karpenter-1
Jul 31, 2023

Building Blocks | May 2023
May 3, 2023

Building Blocks | April 2023
Apr 6, 2023

Building Blocks | March 2023
Mar 1, 2023

Prometheus and Grafana: Observability stack in K8s
Feb 2, 2023

Building Blocks | February 2023
Feb 1, 2023

Building a Kubernetes CRD
Jan 12, 2023

Building Blocks | January 2023
Jan 5, 2023

Building Blocks | December 2022
Dec 22, 2022

Team Amnic at AWS re:Invent 2024
Dec 16, 2024

What Businesses Can Do to Control Runaway Cloud Spend
Nov 28, 2024

Why Cost Visualization Is Imperative to Monitor Your Cloud Spend?
Nov 20, 2024

Amnic is Excited to See You at KubeCon!
Nov 7, 2024

Meet Us at FinOps X Europe, 2024
Nov 7, 2024

Decoding the FinOps Framework
Oct 23, 2024

Experience Amnic's Enhanced Custom Views Feature
Oct 15, 2024

The 3 Pillars of Cloud Cost Observability: Visualization, Control & Management
Oct 8, 2024

AmnicCast with Melissa Parker
Oct 3, 2024

AmnicCast with Satender Patwal
Sep 27, 2024

Understanding Amnic’s Latest Feature: RBAC for Custom Views
Sep 25, 2024

Top 10 Cloud Cost Observability Metrics to Watch
Sep 20, 2024

How to Use AWS Cost Allocation Tags
Sep 10, 2024

The 20 Best FinOps Memes to Make You Chuckle
Sep 4, 2024

Best Practices for Automated Cloud Cost Reporting
Aug 28, 2024

Top 5 Strategies for Managing Cloud Costs
Aug 13, 2024

Managing Lean Infrastructure in the Era of Generative AI
Aug 7, 2024

What Are Common FinOps Roles and Responsibilities?
Aug 1, 2024

Using Cloud Cost Management to Improve DORA Metrics
Jul 25, 2024

How to Properly Provision Kubernetes Resources
Jul 18, 2024

Introducing Amnic’s All New Cost Analyzer
Jul 15, 2024

AmnicCast with Ankur Khare
Jul 10, 2024

How to Mitigate Cloud Cost Surges in AWS
Jul 10, 2024

AmnicCast with Smita Ohja
Jul 2, 2024

Shifting Left: Cloud Cost Observability for DevOps
Jun 18, 2024

Things you should know about cloud cost optimization in 2024
Jun 10, 2024

Demystifying Cloud Cost Observability
May 31, 2024

How Amnic Brought Cloud Cost Observability to Center Stage at AWS Summit
May 16, 2024

What a well optimized Kubernetes looks like
Apr 17, 2024

What is K8s Cost Observability and how to achieve it
Apr 4, 2024

What is Cloud Cost Management?
Mar 4, 2024

Everything you need to know about AWS EC2 Pricing in 2024
Feb 12, 2024

The Ultimate EKS Cost Optimization Guide for 2024
Feb 7, 2024

Understanding FOCUS™ for Beginners
Jan 30, 2024

What is Cloud Cost Observability?
Jan 19, 2024

Cloud Cost Management Strategies 2024
Jan 17, 2024

How to implement FinOps in your Organization
Jan 10, 2024

AKS Pricing & Cost Optimization
Dec 11, 2023

EKS Pricing and How to Optimize your costs
Dec 10, 2023

Decoding the Storage Cost Tiers For Azure
Dec 7, 2023

Breaking down Storage Cost Tiers For GCP
Dec 5, 2023

Running predictable and cost-optimized workloads on GKE
Dec 3, 2023

Cost Optimization on Azure
Nov 30, 2023

Optimizing Pricing on Google Cloud
Nov 27, 2023

Simplifying Data Transfer Costs across AWS
Nov 24, 2023

A guide to navigating AWS Storage Costs
Nov 16, 2023

What is Internal Developer Platform (IDP) ?
Aug 25, 2023

Unlocking Full Potential of AWS with Karpenter-2
Aug 9, 2023

Unlocking Full Potential of AWS with Karpenter-1
Jul 31, 2023

Building Blocks | May 2023
May 3, 2023

Building Blocks | April 2023
Apr 6, 2023

Building Blocks | March 2023
Mar 1, 2023

Prometheus and Grafana: Observability stack in K8s
Feb 2, 2023

Building Blocks | February 2023
Feb 1, 2023

Building a Kubernetes CRD
Jan 12, 2023

Building Blocks | January 2023
Jan 5, 2023

Building Blocks | December 2022
Dec 22, 2022

Build a culture of
cloud cost observability

Build a culture of
cloud cost observability