9 FinOps Tools That Simplify Cloud Cost Reporting
11 min read
FinOps
Tools
Cost Control

Table of Contents
Ever opened your cloud bill and felt like you were reading a different language? You’re not alone. For many teams, cloud costs pile up quickly, but making sense of them is often harder than expected.
Instead of staring at endless usage data, FinOps tools for cloud cost reporting helps translate those numbers into something meaningful. It translates the complex usage data into insights your teams can actually use.
The right reports ensure finance, engineering, and leadership all see the same story, just from the context and language that matters to them. Whether that’s tracking which team spent what, spotting unusual spikes, or planning ahead.
Let’s unravel a few amazing FinOps tools for cloud cost reporting that are currently trending in the industry.
Why Cloud Cost Reporting Matters?
Cloud spend is one of the fastest-growing line items in modern IT budgets, and without proper reporting, it’s nearly impossible to understand where the money is going or why. As organizations scale across multiple clouds, Kubernetes clusters, and SaaS platforms, costs quickly become fragmented. FinOps Tools for cloud cost reporting brings order to this complexity by connecting spend to teams, projects, or even specific features.
Beyond visibility, cloud cost reporting drives accountability. Engineers can see how their design choices impact spend, finance gains accurate data for forecasting and budgeting, and leadership can make strategic calls with confidence.
Reports tailored to different personas like engineering, finance, product, or leadership ensure that each stakeholder gets the context they need. In regulated industries, audit-ready reporting adds another layer of value by meeting compliance and governance requirements.
In short, cloud cost reporting has transformed from being “what did we spend?” to enabling smarter decisions, fostering collaboration, and making cloud investments work harder for the business. It’s the backbone of any strong FinOps practice.
Key Elements of Effective Cloud Cost Reporting
Not all reports are created equal. While many tools can show a cost breakdown, the most effective ones make cloud spend understandable, shareable, and actionable for every stakeholder. Here’s what effective cloud cost reporting looks like:
Customization for every role and persona
Reporting needs to adapt to its audience. Finance teams care about budgets and forecasts, engineering teams need granular service- or Kubernetes-level visibility, and leadership often looks for high-level summaries tied to business outcomes. So, look for a cloud cost reporting FinOps tools that is role- and persona-specific so that each team gets exactly the insights they need, without wading through irrelevant data.
Stakeholder- and audit-ready views
Beyond day-to-day reporting, organizations need audit trails and executive-ready views. Look for a FinOps tools with a reporting structure that makes it simple to generate reports for compliance checks, board updates, or cost audits, ensuring accuracy and trust without requiring hours of manual data prep.
Automation and scheduled delivery
Reports should arrive when and where they’re needed. An effective FinOps tool for cloud cost reporting lets you automate report scheduling and delivery, whether that’s a weekly breakdown emailed to finance, a daily anomaly alert pushed to Slack, or live dashboards for engineering leads. This eliminates the lag of manual reporting and keeps teams in sync.
Role-Based Access Control (RBAC)
Cloud cost data is sensitive, and not every team should see everything. With RBAC capability, you can ensure the right level of visibility for each user. Finance might see organization-wide allocations, engineering managers see their team’s costs, and executives see high-level summaries. This balance of accessibility and control makes collaboration seamless without compromising security.
Actionable insights built in
The real value of reporting is turning data into action. An effective FinOps tool for cloud cost reporting shouldn’t just show what you spent, it should explain why costs changed and recommend what to do next. Whether that’s rightsizing unused resources, managing Kubernetes costs, or analyzing anomalies, Amnic’s reports empower teams to take immediate steps toward optimization.
Together, these elements transform reporting from static spreadsheets into a dynamic decision-making system that helps every stakeholder understand, trust, and act on cloud.
Also read: 5 Common Cloud Cost Reporting Mistakes (And How to Avoid Them)
FinOps Tools for Cloud Cost Reporting
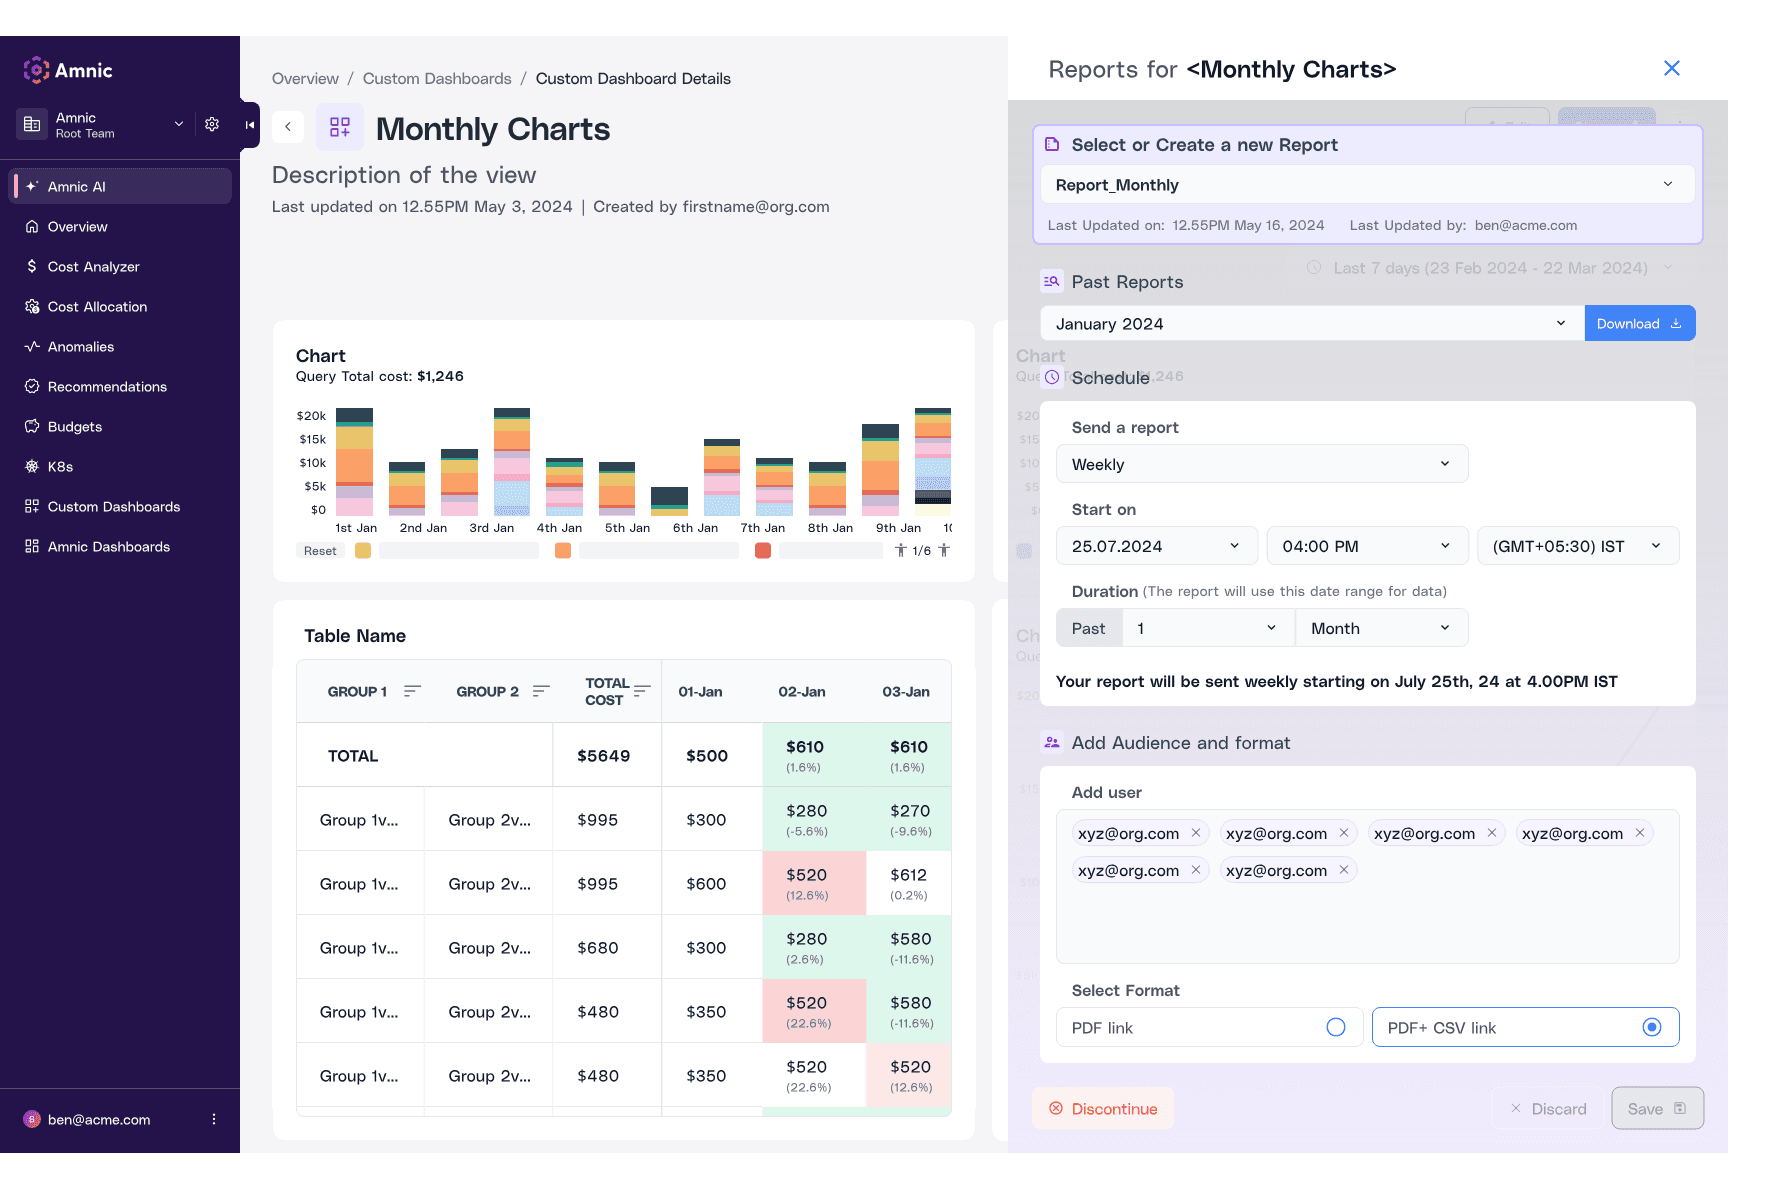
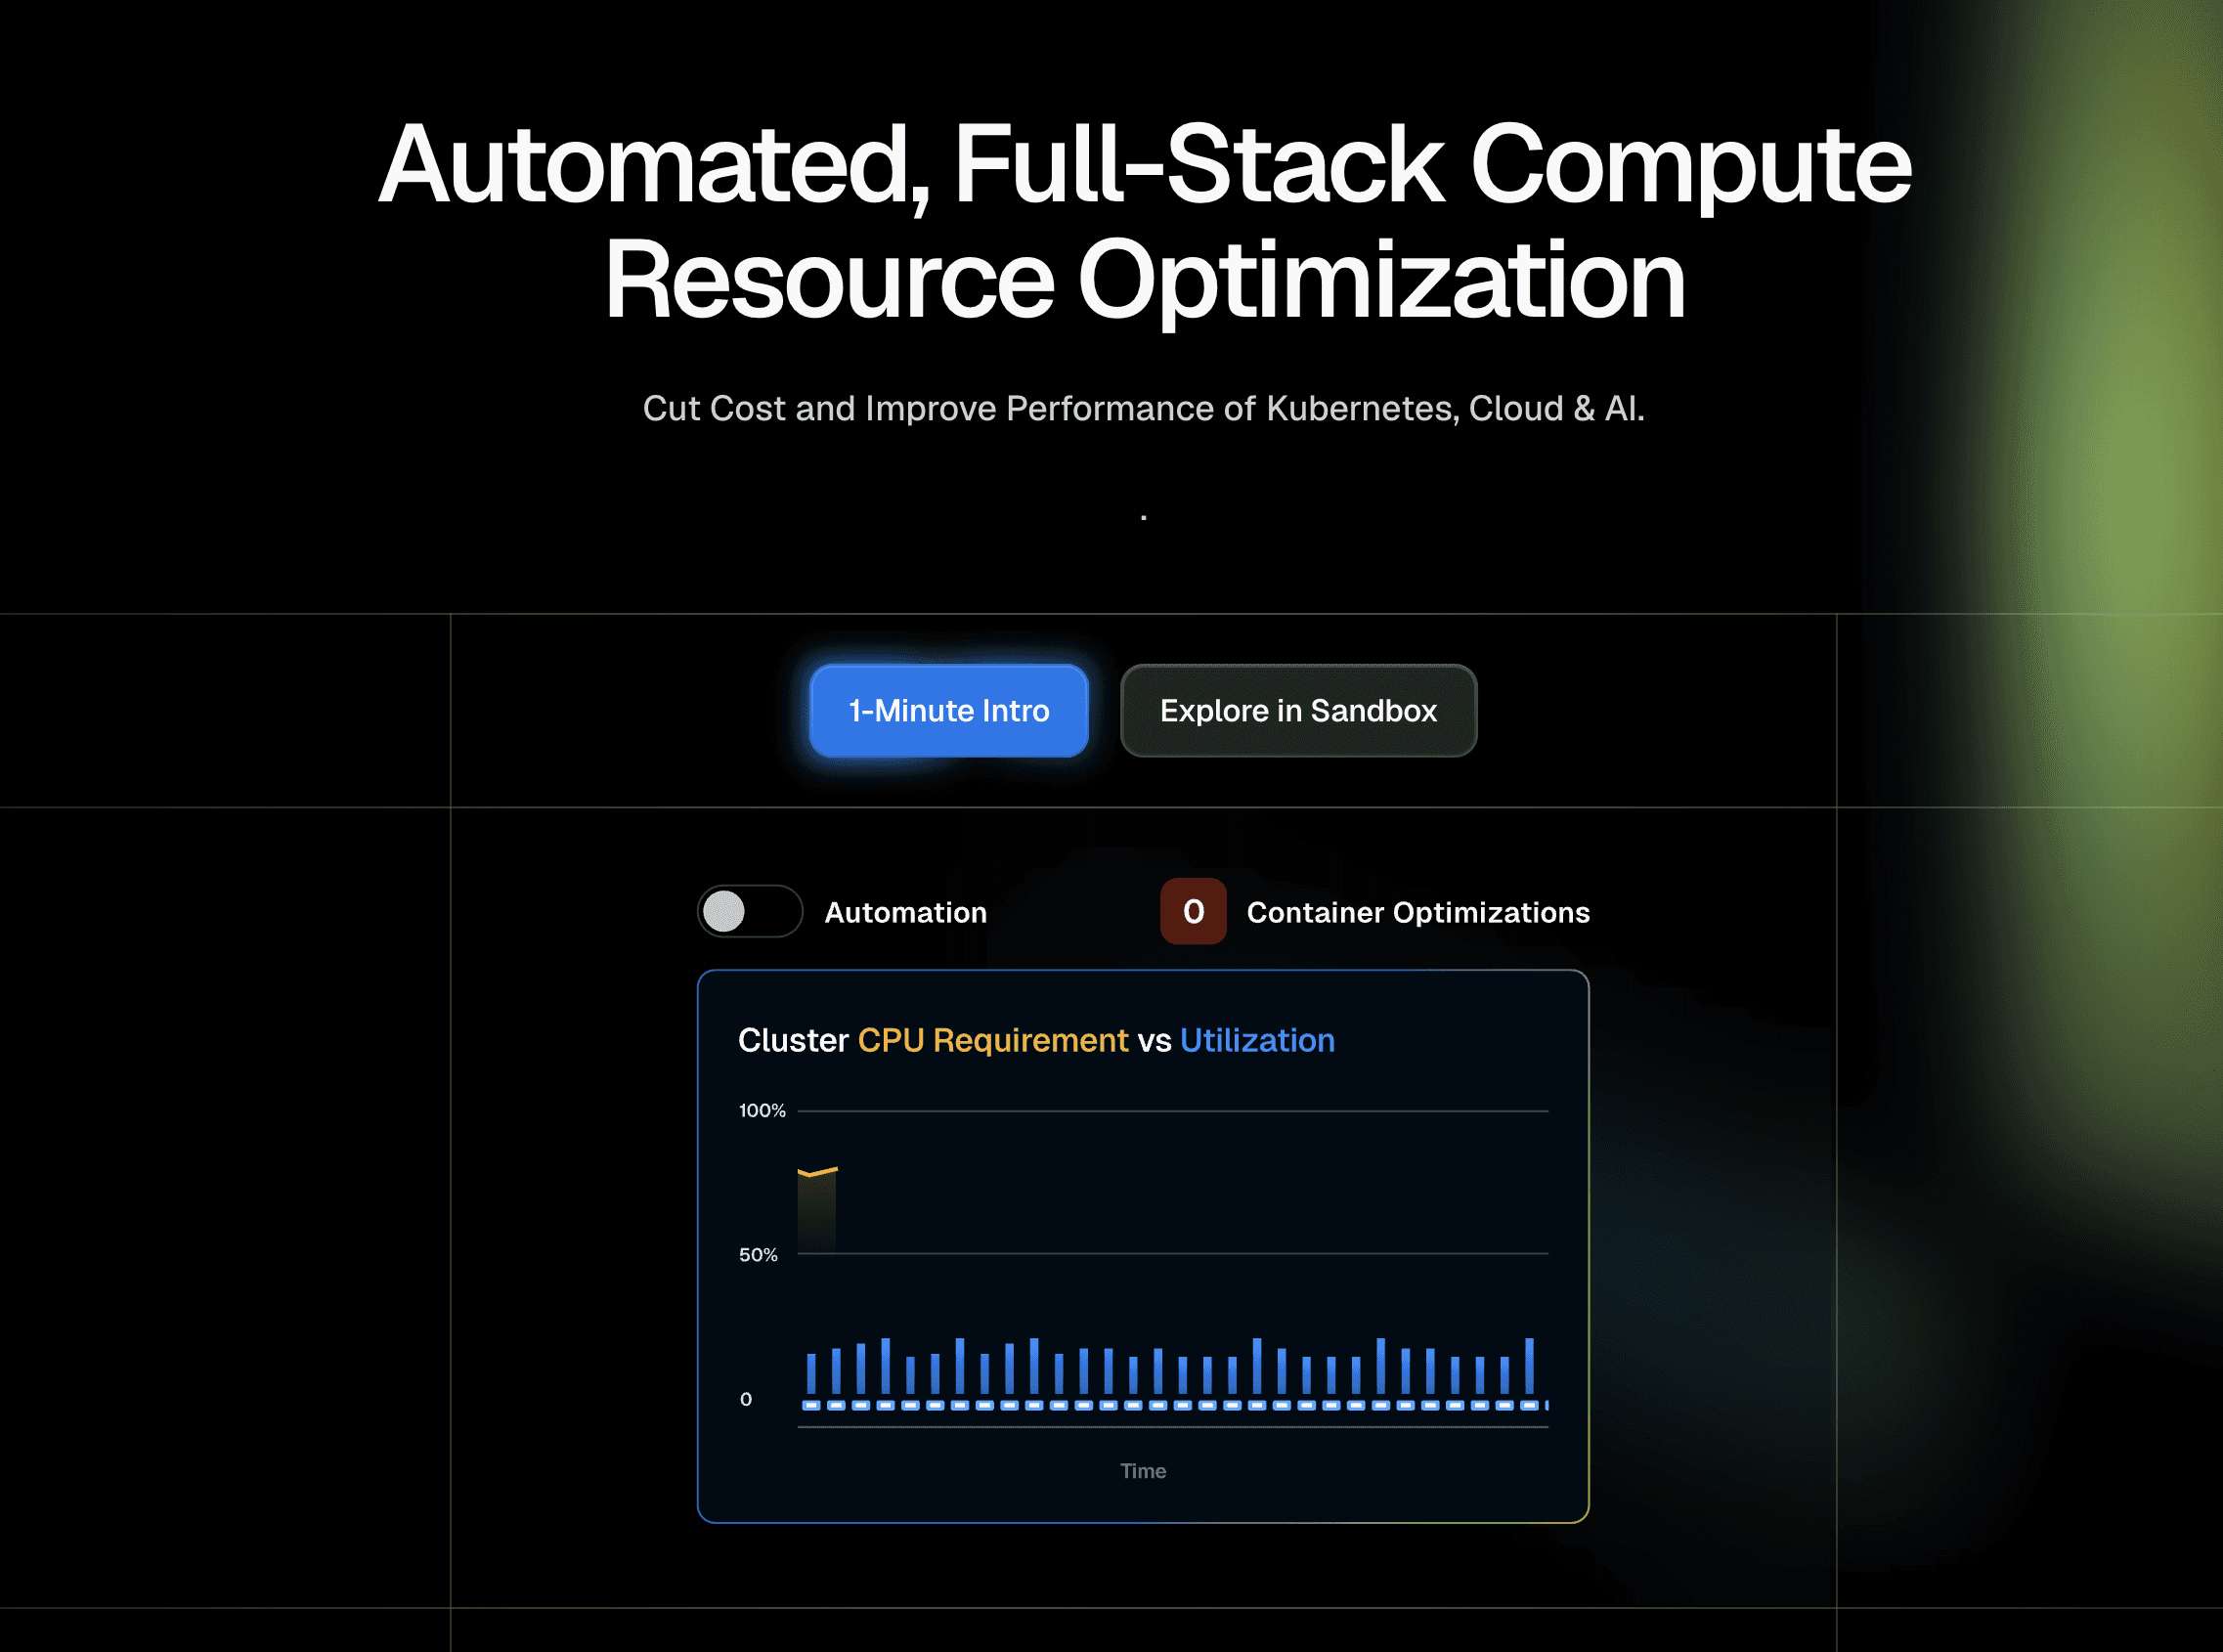
Amnic is a FinOps tools powered by AI Agents, helping businesses gain clarity on every dollar of their cloud spend. Amnic delivers context-aware and role-specific cost insights that bring together the financial, business, and engineering contexts within modern cloud teams.
Leading FinOps, DevOps, and Engineering teams rely on Amnic to help create cloud cost accountability, better cost allocation, and manage their infrastructure spend more efficiently. Amnic offers automated cloud cost reporting and analysis with scheduled updates, saveable reports, pre-built visualizations, and custom dashboards.
With Amnic’s Reporting Agent, businesses can now generate persona-specific and stakeholder-ready reports 10x faster with natural-language queries.
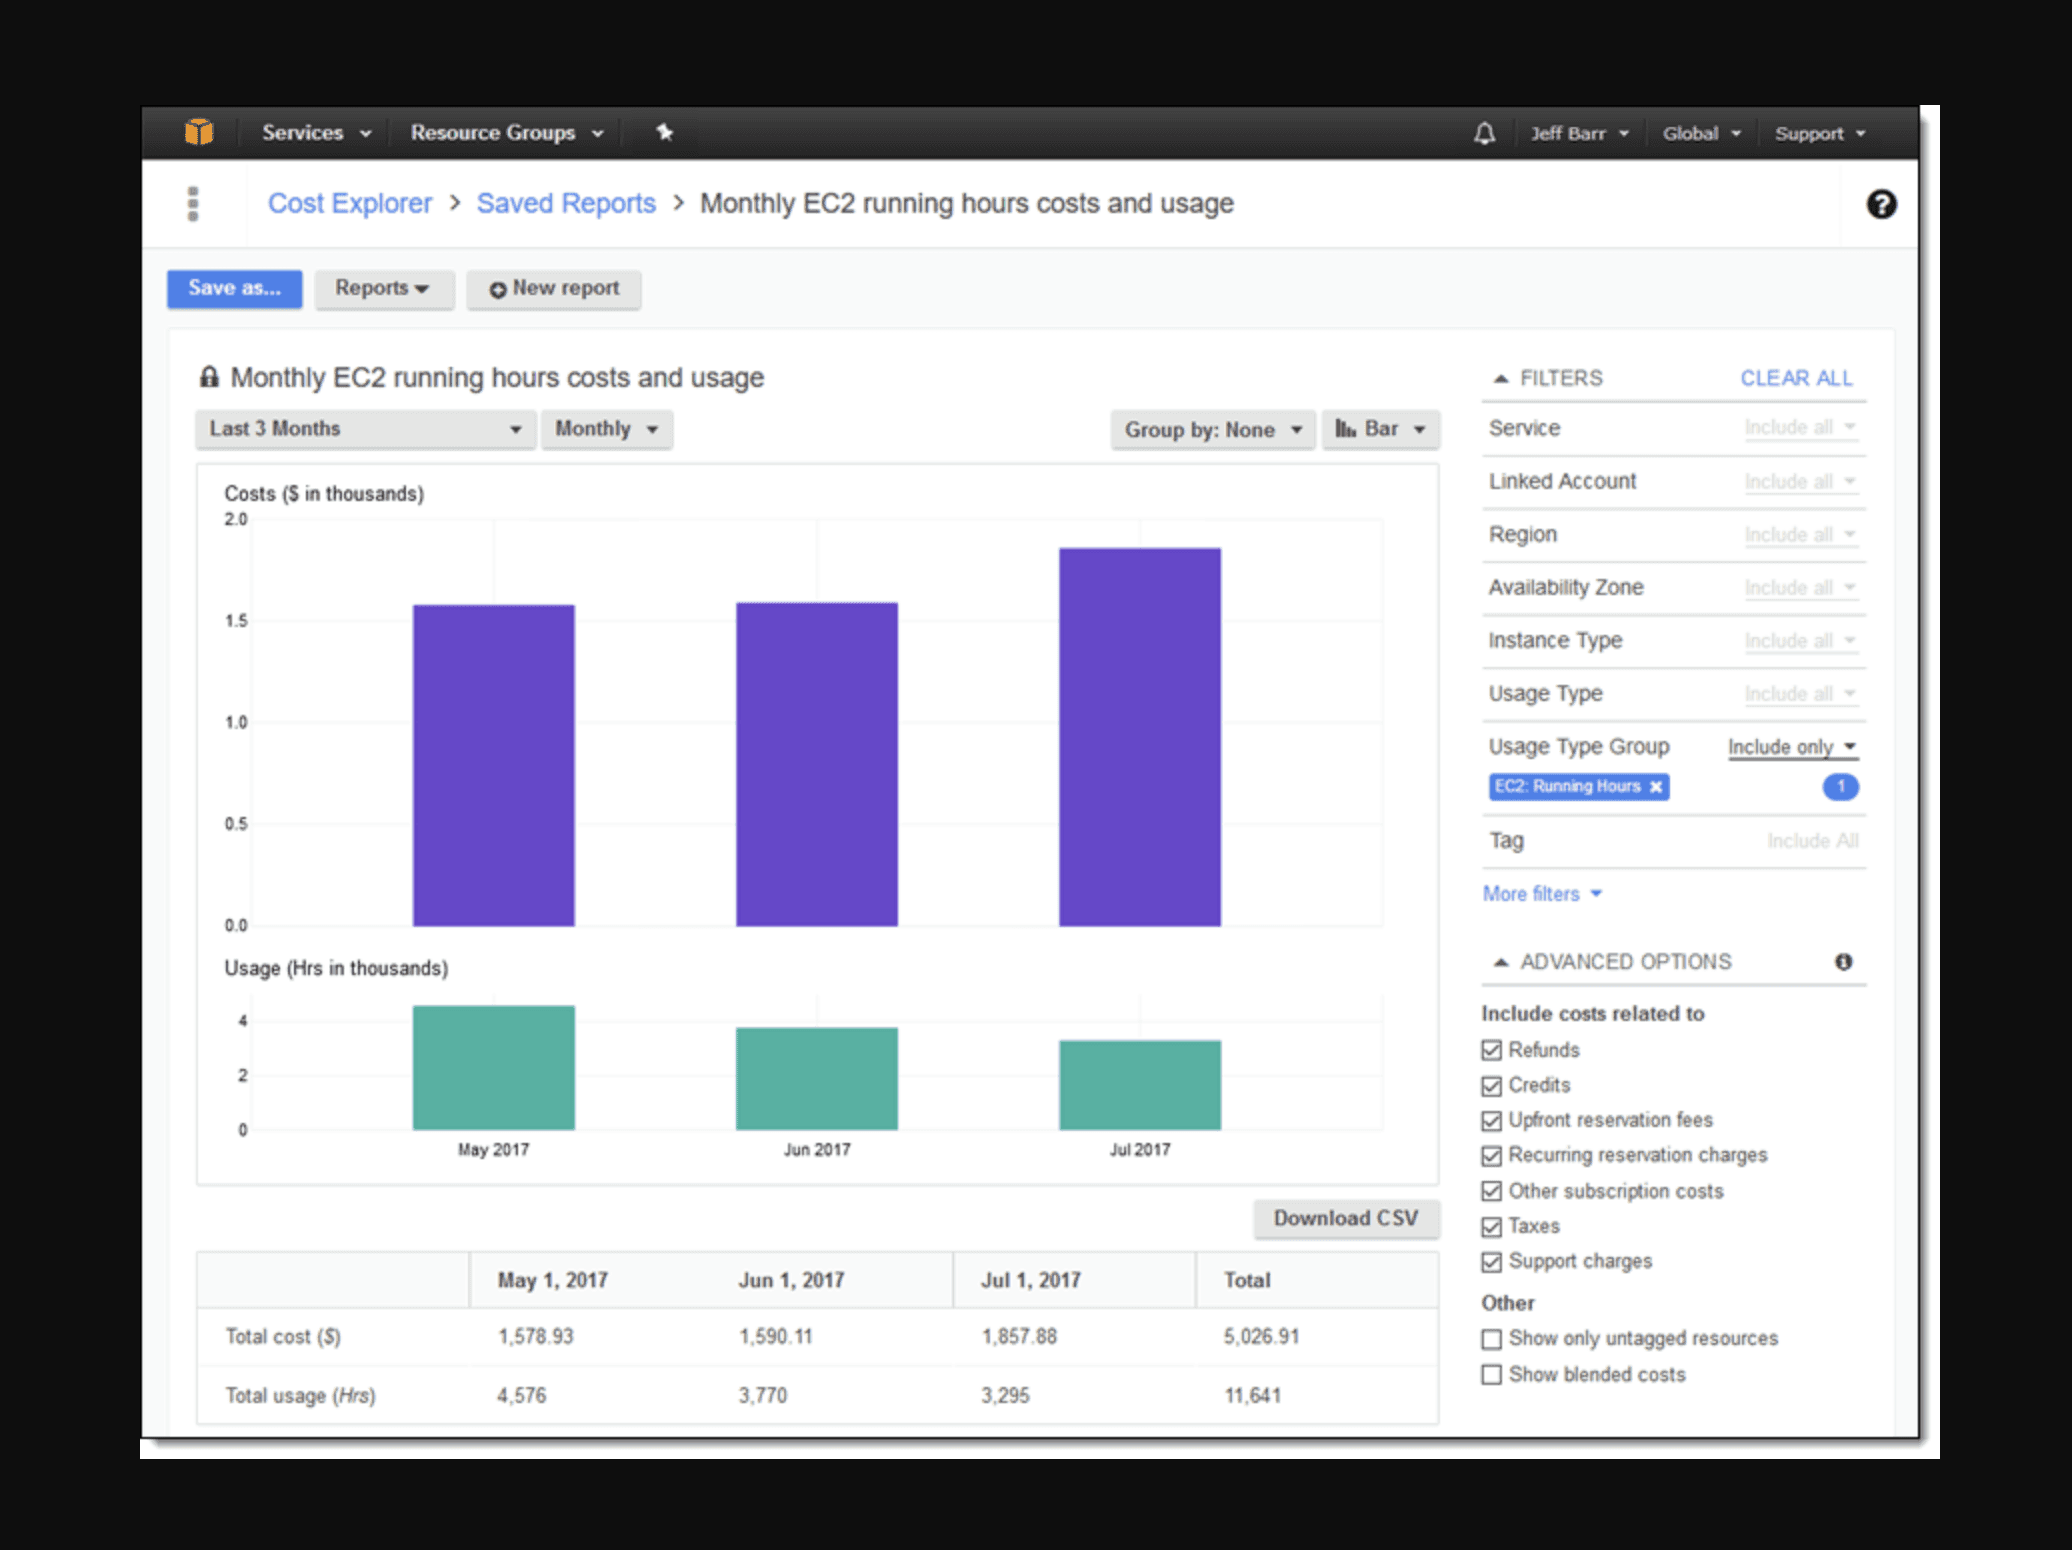
AWS Cost Explorer lets you visualize, understand, and manage your AWS costs and usage. With its intuitive interface, you can quickly create custom reports to analyze both high-level trends like total costs across all your AWS accounts and granular details, such as specific services or usage patterns driving expenses.
It also supports anomaly detection to spot unexpected cost spikes. You can save and share your reports to collaborate with your team so that everyone has the insights needed to make informed, cost-efficient decisions.
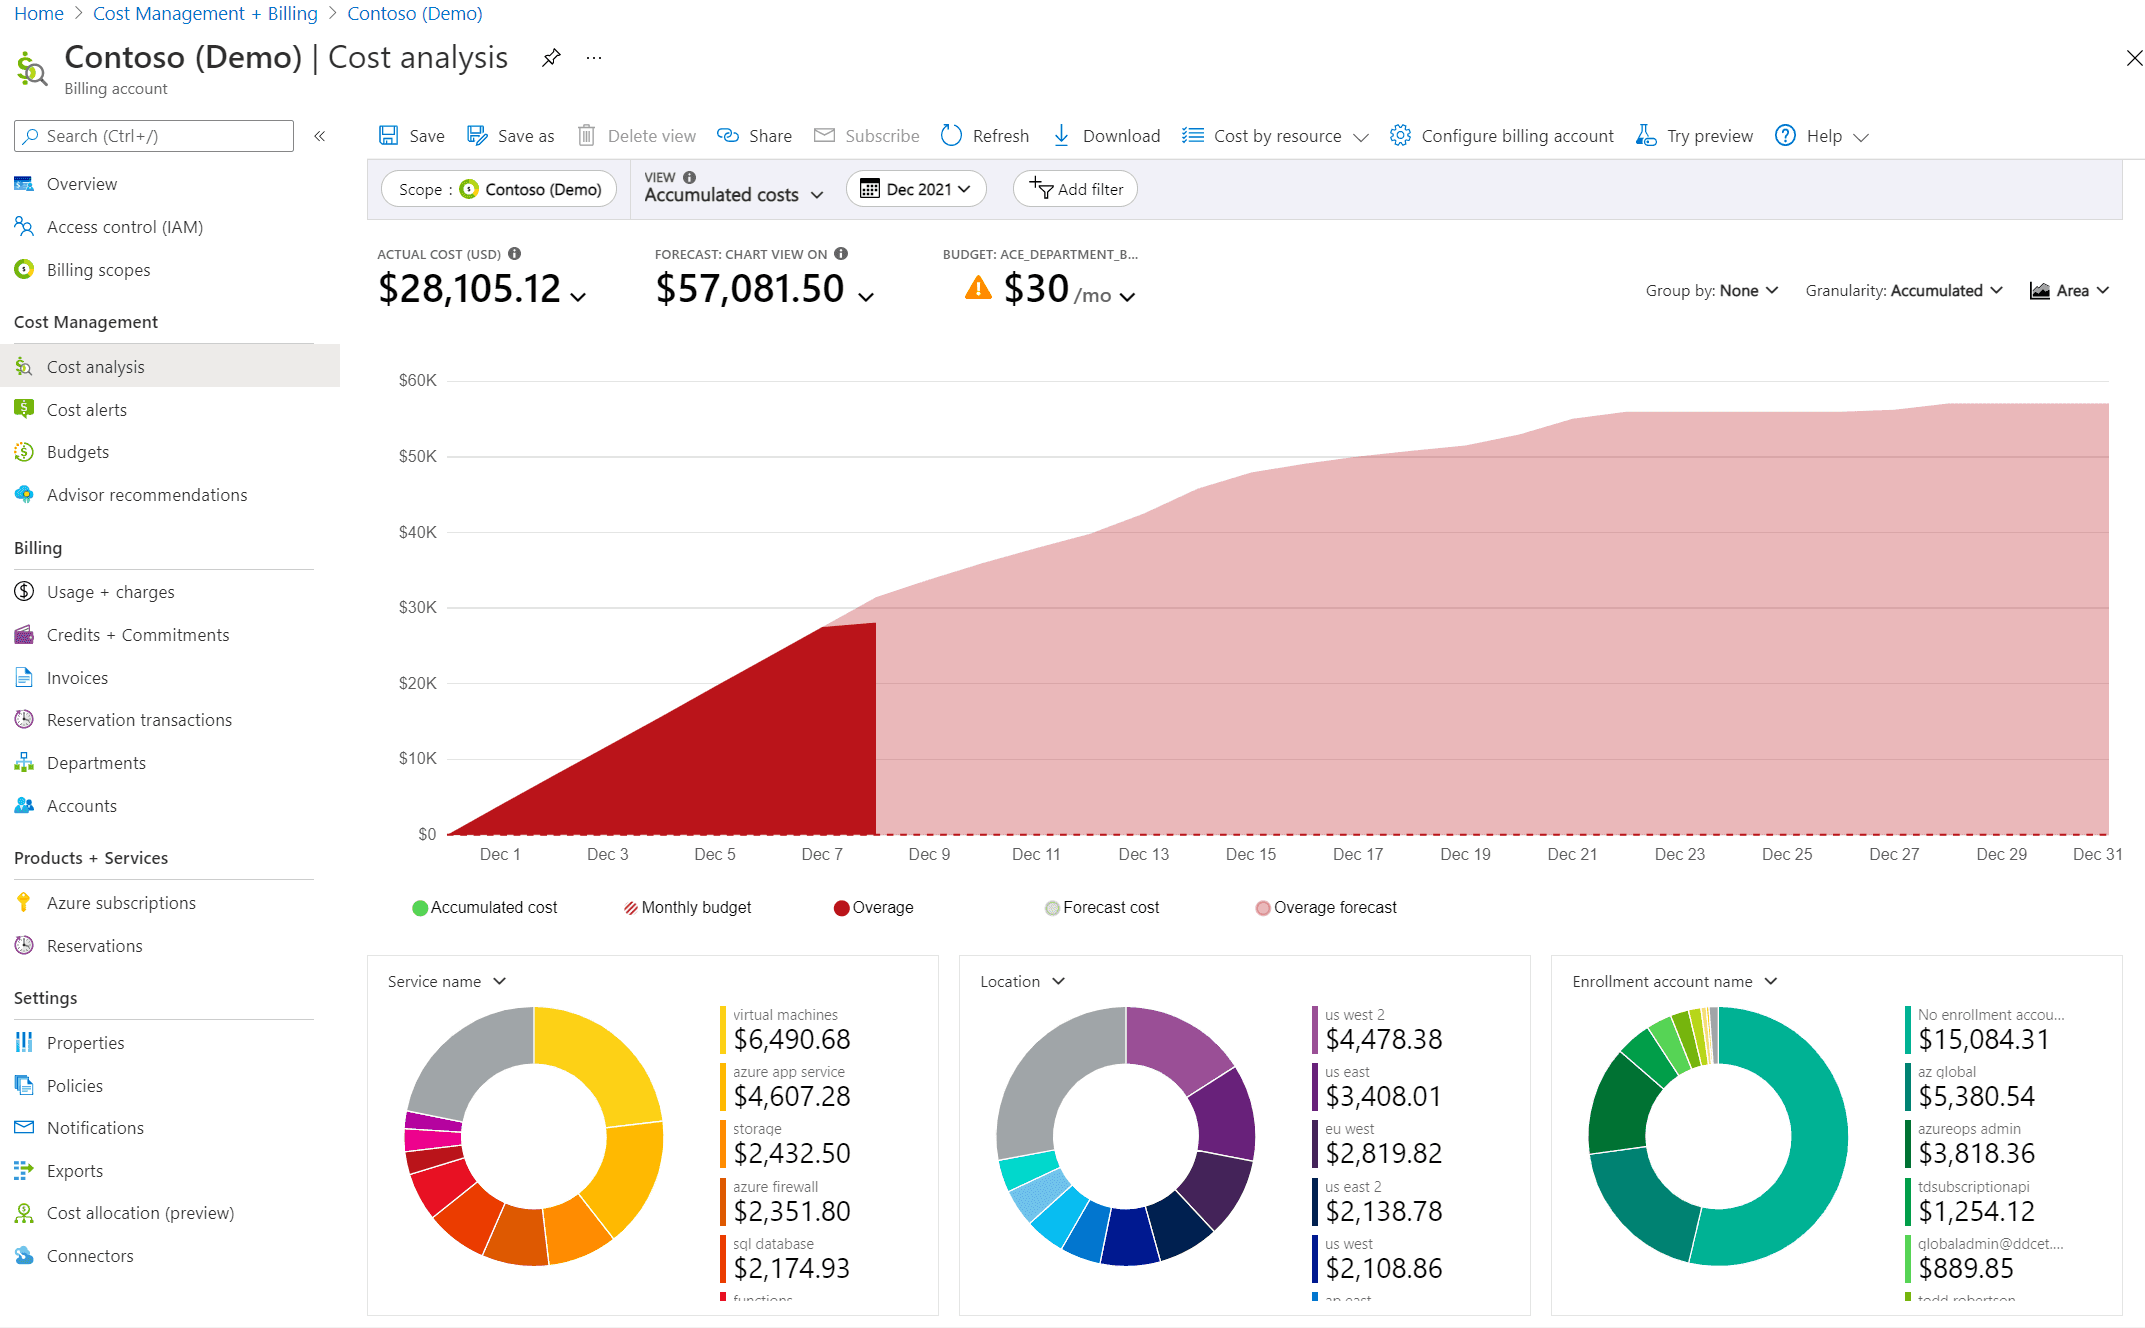
Azure Cost Management offers powerful reporting capabilities through its Cost Analysis feature. It allows you to visualize and break down organizational spend, track cost trends over time, and share customized views with stakeholders. You can compare actual costs against budgets to monitor progress and quickly spot irregularities.
For advanced reporting needs, Azure also supports scheduled exports of raw cost data, making it easier to build custom dashboards or integrate cost insights with internal systems.
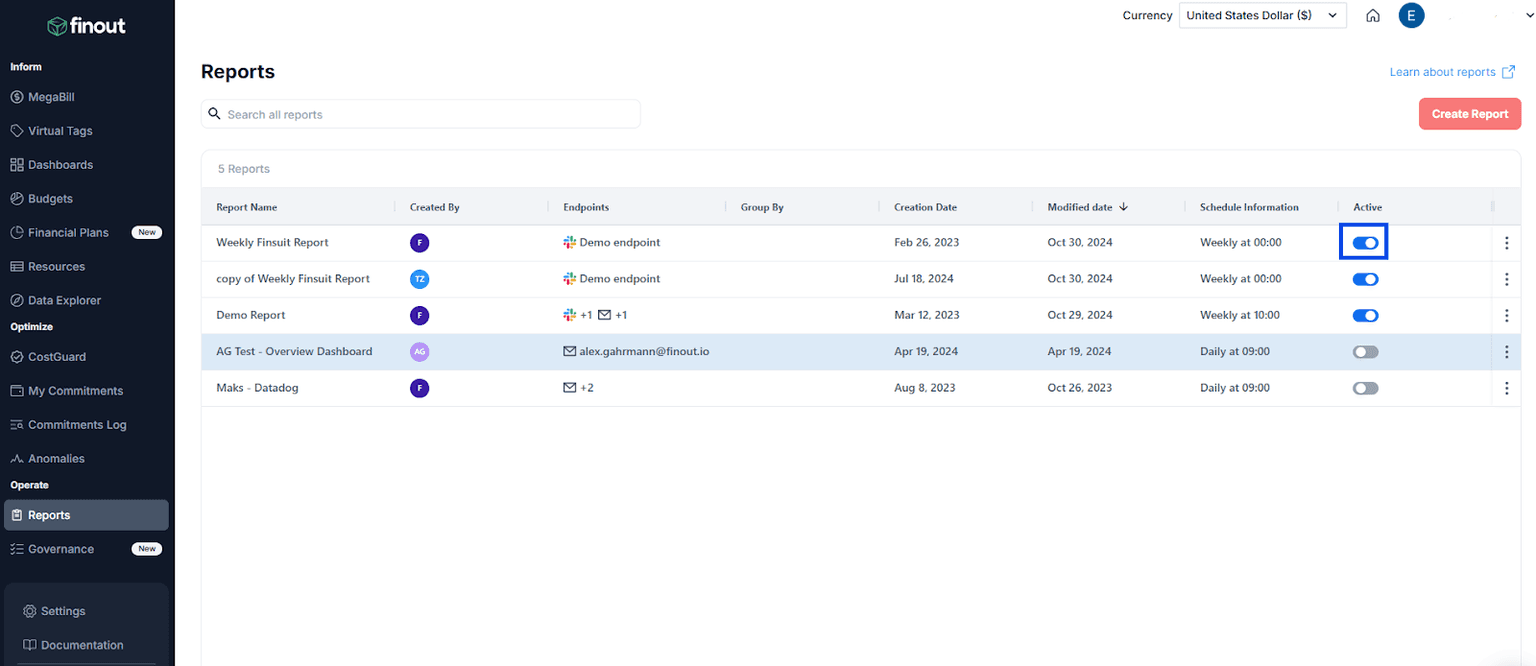
Finout simplifies cloud cost reporting by making it easy to keep teams updated with the data that matters most. Reports can be scheduled daily, weekly, or monthly and shared directly through email, Slack, or Microsoft Teams.
What makes Finout especially useful is its ability to tailor reports for different teams, sending each group only the data relevant to them. By customizing delivery based on filters and groupings, Finout ensures every stakeholder receives clear, accessible insights without being overwhelmed by unnecessary information.

Ternary helps Finance, Engineering, and FinOps teams track, analyze, and report on cloud costs without relying on spreadsheets or raw billing exports. Powered by FOCUS™, it standardizes cost data for consistent reporting across teams and clouds. Users can build custom reports with filters for service, provider, region, or time, and save or share them easily.
Dashboards are customizable with up to 25 widgets, including KPIs, budgets, and notes for added context. Scoped Views ensure stakeholders only see relevant data, connecting cloud costs to business impact in real time.
Densify offers a wide range of reports for managing both on-prem and cloud environments, while also giving users the flexibility to build custom reports. Using its Business Intelligence report designer (powered by JasperReports Server), teams can create tailored dashboards that align with specific business needs.
Reports are automatically refreshed with Densify’s latest infrastructure and utilization data, ensuring accurate, up-to-date insights. Published reports are easily accessible to all users, making it easier to track costs, usage, and optimization opportunities.

Managing cloud spend can feel overwhelming when infrastructure changes daily and bills run into millions of lines. IBM Cloudability helps simplify this by providing flexible dashboards and resource-level reporting across single or multi-cloud environments.
With its customizable dashboards, you can build detailed widgets, drill down into specifics, and share insights with teams, while controlling who sees what. Cloudability also offers a library of ready-made reports and the ability to create custom ones, ensuring you always have near real-time, role-based visibility into costs and usage across all your cloud providers.
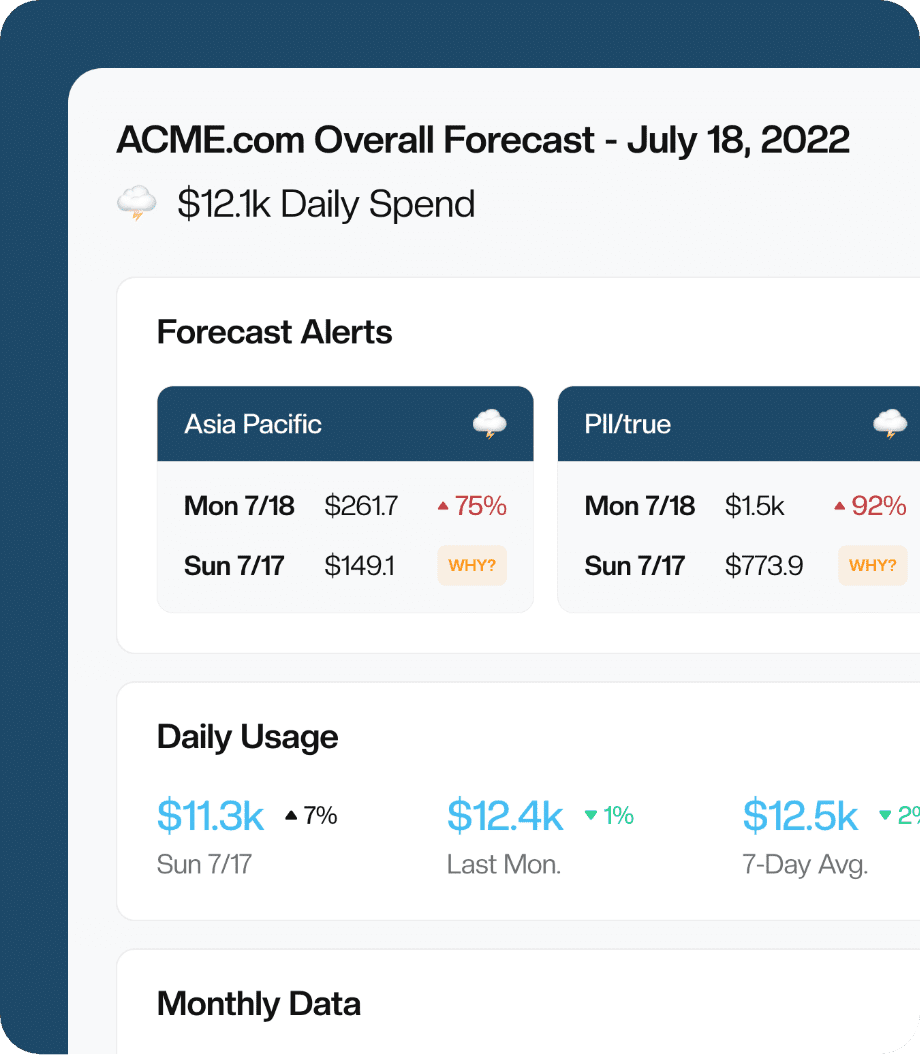
CloudForecast makes cloud cost reporting simple and team-friendly by focusing on actionable insights instead of raw data dumps. It delivers daily cost group reports straight to email or Slack, showing spending trends, anomalies, and breakdowns by product, region, or tag. When there’s a spike, the “Why?” drill-down table automatically pinpoints the exact service or tag responsible, helping teams act fast.
For leadership and finance teams, CloudForecast generates monthly financial reports in Excel format, offering a clean, executive-ready view. It also supports custom reports, allowing businesses to track costs by tags or sub-accounts, set budgets, and automate reporting workflows.
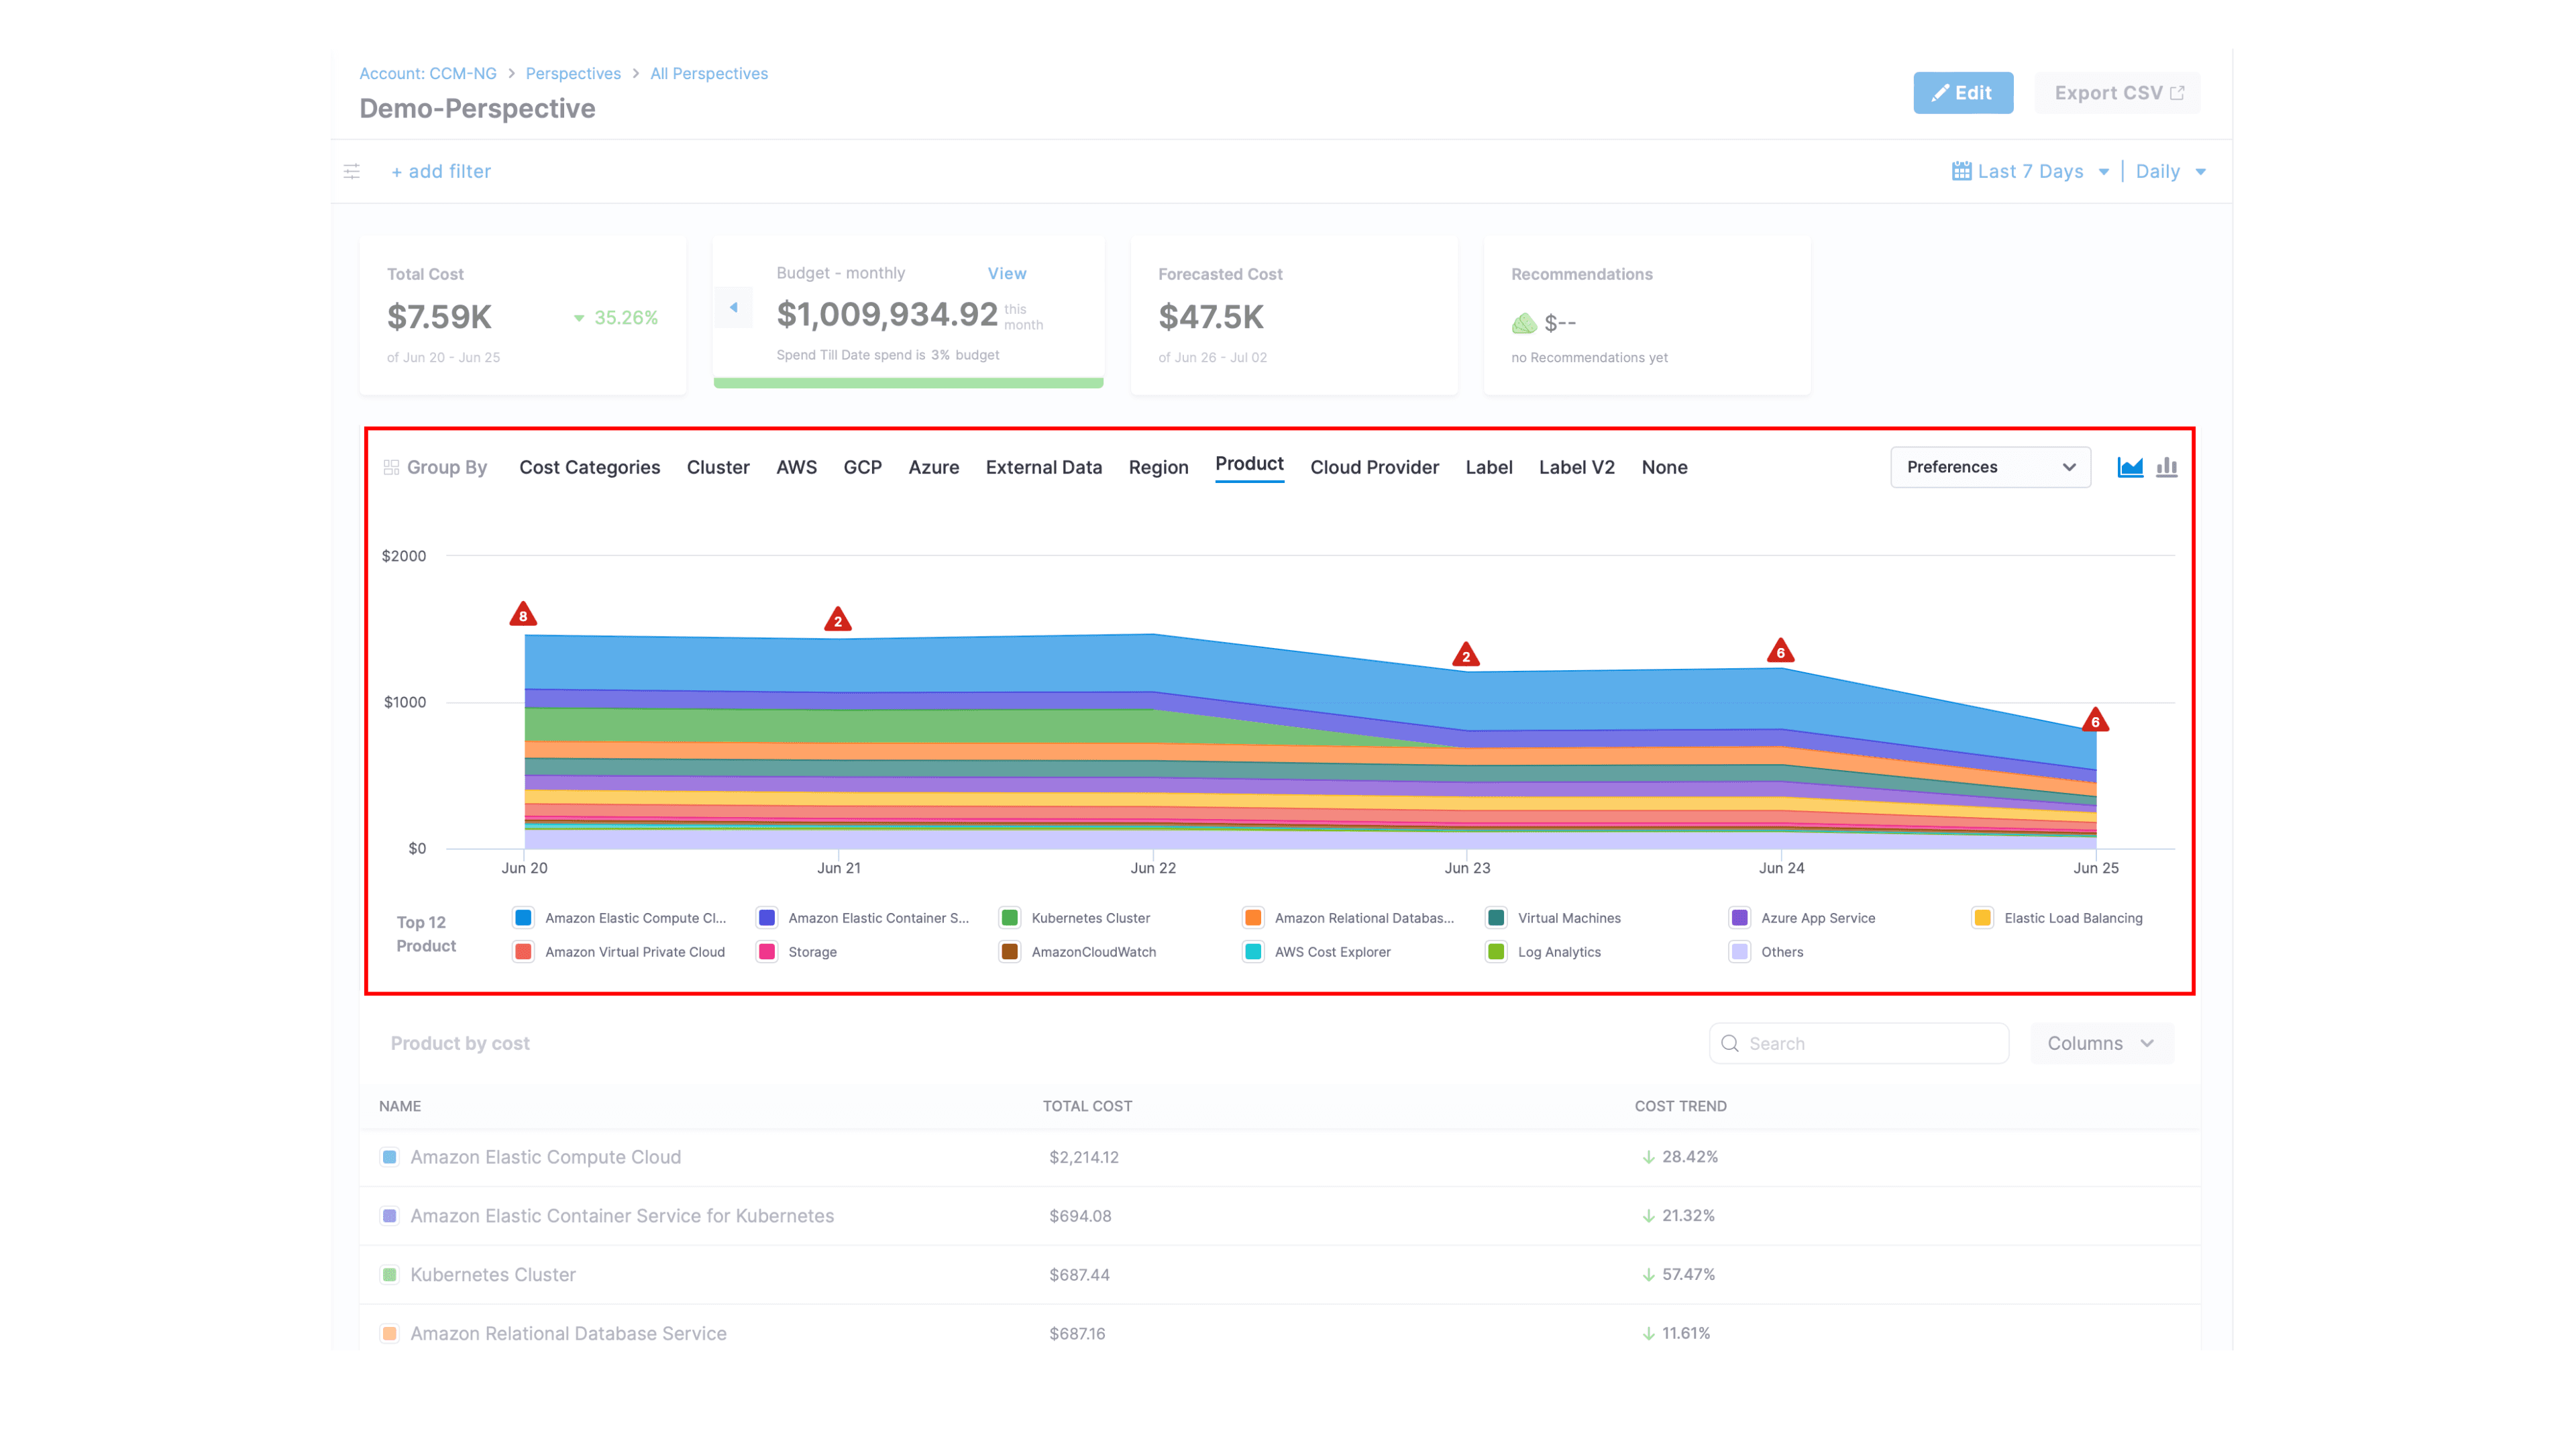
Harness Cloud Cost Management (CCM) brings together a range of reporting capabilities that make it easier for businesses to monitor, analyze, and optimize their cloud spend. With anomaly detection, teams can quickly spot unusual spikes in usage or costs before they spiral into bigger issues.
The Perspectives feature helps organize cloud resources based on business context, whether by project, department, or region, so reporting always aligns with organizational goals. Interactive dashboards give users a clear, customizable view of their cloud costs, while Cost Categories enable precise allocation of expenses across teams, projects, or clients. Together, these reporting tools provide both the visibility and control needed for effective FinOps practice.
Summing up
The right FinOps tool for cloud cost reporting will not stop after telling you what you spent; it will reveal why you spent it and what to do next.
Amnic’s cloud cost reporting capability delivers automated, role-specific, and audit-ready reports built for every stakeholder like engineers and finance leader. So, you can now move beyond spreadsheets and start making decisions with confidence.
If you’re ready to simplify reporting and put your cloud spend in context, it’s time to take Amnic for a spin.
[Check out Amnic’s Cloud Cost Reporting]
[Request a demo and speak to our experts]
[Get yourself a free 30-day trial with Amnic]
[Download our free FinOps resources]
Recommended Articles
Other Amnic Capabilities You Can Try
Cost Allocation: Assign costs across teams, projects, or workloads with precision.
Kubernetes Cost Management: Monitor Kubernetes cluster performance, usage, and costs
Anomaly Detection: Spot unusual cost spikes before they become expensive surprises.
Budgeting & Forecasting: Plan and predict cloud spend with data-backed accuracy.
Recommendations: Get actionable rightsizing and optimization suggestions.
FAQs about FinOps Tool for Cloud Cost Reporting
1. What is a FinOps tool for cloud cost reporting?
A FinOps tool for cloud cost reporting helps organizations track, analyze, and present cloud spend data in a way that aligns with business goals. These FinOps tools make it easier to connect cloud costs to teams, projects, or services, providing role-specific insights for finance, engineering, and leadership.
2. Why do businesses need a FinOps tool for cloud cost reporting?
Cloud costs often grow rapidly and unpredictably. A FinOps tool for cloud cost reporting ensures visibility, accountability, and control by giving teams clear insights into where money is going and why. This enables smarter budgeting, forecasting, and optimization.
3. What features should I look for in a FinOps tool for cloud cost reporting?
Key features include role-based dashboards, automated scheduling and sharing of reports, audit-ready compliance, integration with multiple cloud providers, anomaly detection, and the ability to tie costs back to business units or products.
4. How does Amnic help with cloud cost reporting?
Amnic simplifies cloud cost reporting by offering persona-specific, automated, and shareable reports. With built-in RBAC and anomaly alerts, Amnic ensures that every stakeholder like finance, and engineering has the right level of visibility to make cost-conscious decisions.
5. Can Amnic integrate with multiple cloud platforms for unified reporting?
Yes. Amnic integrates with AWS, Azure, GCP, Kubernetes, and SaaS tools to give you a single, consolidated view of cloud spending across your entire ecosystem. This makes reporting seamless and eliminates the need to juggle multiple dashboards.
6. Who benefits the most from a FinOps tool for cloud cost reporting?
Finance teams use it for forecasting and budget control, engineers rely on it to identify optimization opportunities, leadership gets a strategic overview of cloud investment, and auditors gain transparent, accurate records.
Better visibility and management into AI Tokens?
Start with a 30 day trial
Connect leading LLMs
24 hour time to value
Stay ahead of AI Spend

Make AI spend visible, controllable, and accountable.
Gain insights into your AI token costs at a team, customer, business unit and individual user level to measure and manage AI utilization.
Recommended Articles

8 Best Llama Cost Management Tools in 2026
Read More

8 Best Amazon Bedrock Cost Optimization Tools for 2026
Read More

7 Best Amazon Bedrock Cost Monitoring Tools
Read More

8 Best Gemini Cost Visibility Tools for 2026
Read More

7 Best Multimodal Cost Optimization Tools for 2026
Read More

5 Best Anthropic Cost Allocation Tools for 2026
Read More


