Breaking Bill: Deciphering Google Compute Engine (GCE) Costs
10 min read
Breaking Bill
GCP

Table of Contents
Imagine spinning up a few Google Compute Engine (GCE) instances for a new project, thinking your cloud spend will stay under control. A month later, you open your billing dashboard, and your GCP bill has jumped by 30-50%, even though nothing “major” changed in your workloads.
If this sounds familiar, you’re not alone. GCE pricing is dynamic and multi-layered, and small decisions can quietly inflate costs:
VMs might look cheap, but persistent disks, snapshots, and premium OS licenses stack up quickly.
Data moving across regions or zones can silently add hundreds or thousands in network egress fees.
Preemptible VMs, autoscaling, and machine family choices offer savings, if configured correctly, but can backfire if mismanaged.
Discounts like Sustained Use or Committed Use can create confusion, leaving teams unsure if they’re actually saving.
This complexity often means teams spend hours, sometimes days, digging through scattered billing dashboards, trying to understand why costs don’t match expectations.
In this part of our Breaking Bill series, we’ll break down exactly how Google Compute Engine costs are structured, the hidden charges to watch out for, and practical steps to optimize your spend. By the end, you’ll know how to stop budget leaks, reclaim wasted spend, and plan future usage with confidence.
Why GCE Costs Spiral Out of Control
Even experienced teams can get blindsided by Google Compute Engine costs. While the pricing might look straightforward at first glance, several factors can cause your cloud bill to escalate quickly:
1. Instance pricing seems simple, until extra charges appear
At first, you see the hourly or per-second rate of a VM and think it’s manageable. But that’s just the tip of the iceberg. Extra costs creep in from:
Attached storage: Boot disks and persistent disks continue to accrue charges even if your VM isn’t doing much.
Premium OS licenses: Running Windows, RHEL, or SUSE adds per-CPU fees.
Accelerators: Adding GPUs or TPUs can multiply your compute costs unexpectedly.
Without careful monitoring, what seemed like a $0.10/hr VM can easily turn into a $0.50/hr instance when all components are included.
2. Hidden components quietly add up
Some costs aren’t obvious until the bill arrives:
Network egress: Sending data across regions, zones, or to the public internet can generate substantial charges. Many teams underestimate these, especially with microservices and multi-region architectures.
Snapshots and backups: Snapshots accumulate over time and can grow expensive if old versions aren’t deleted.
Idle resources: VMs or disks left running “just in case” may not contribute to active workloads but still incur charges.
Also read: Ingress vs. Egress: Why Data Egress Costs So Much
3. Labels and tags aren’t enforced, making cost allocation tricky
Even with Google Cloud’s labeling system, many teams fail to apply it consistently. Without proper tagging strategies and labeling:
Costs are hard to attribute to teams, projects, or services.
Shared resources like Kubernetes clusters or NAT gateways can appear under “miscellaneous,” masking true spend.
Finance and engineering teams struggle to make informed decisions because the billing data isn’t tied to business operations.
4. Discounts are available, but often misapplied
Google offers several ways to reduce costs, but they can be confusing:
Sustained Use Discounts (SUDs) kick in automatically, but only after a VM runs a certain portion of the month. Misunderstanding how they apply can lead to missed savings.
Committed Use Discounts (CUDs) require 1-3 year commitments. Committing to the wrong resource type can lock teams into paying for underutilized capacity.
Preemptible VMs offer massive savings but can terminate at any moment, making them unsuitable for certain workloads.
Without clear planning, teams either fail to utilize these discounts or apply them incorrectly, leading to unnecessary overspend.
What Really Makes Up Your Google Compute Engine Bill?
Many teams assume that cloud bills are mostly VM costs, but in reality, VMs are just one piece of the puzzle. Understanding each component is key to predicting spend and identifying optimization opportunities.
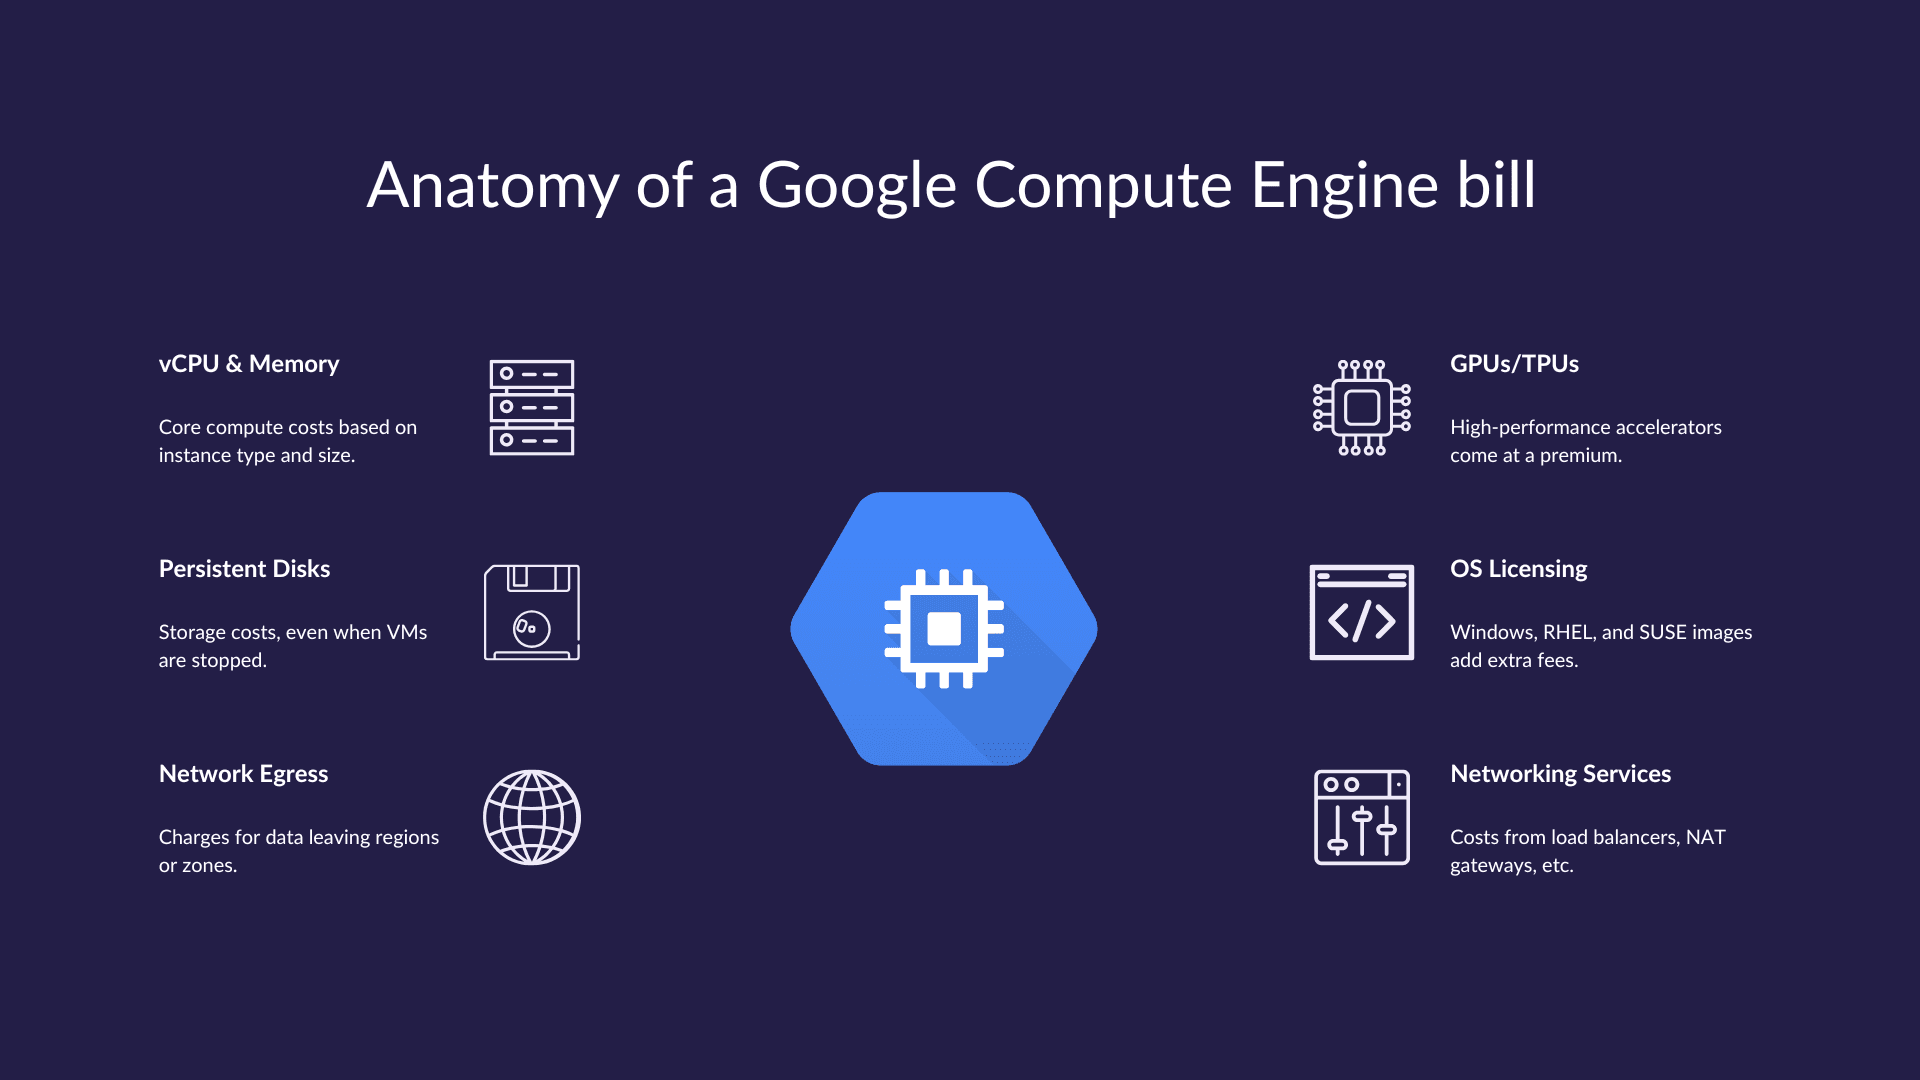
Cost Component | Description | Hidden Gotcha/Example |
vCPU + Memory | The base cost for running a VM depends on the number of virtual CPUs and the amount of memory you allocate. | Varies by machine family: an |
Persistent Disk (PD) | Attached storage for your VMs, including boot disks and additional volumes. | Idle disks still cost money: You might stop a VM, but forget the disk is still attached. For example, a 500 GB SSD PD could cost over $60/month even if the VM isn’t running. |
Network Egress | Data leaving Google Cloud, whether to another region, zone, or the internet. | Cross-region traffic is expensive: Transferring 1 TB of data between regions can cost hundreds of dollars per month. Many teams underestimate this, especially in multi-region architectures. |
GPUs/TPUs | Accelerators used for machine learning, AI, or high-performance computing workloads. | Premium pricing: Adding a single A100 GPU to a VM can increase costs by hundreds of dollars per month. |
OS Licensing | Windows, RHEL, SUSE, or other premium operating system images. | Charged per vCPU/hour: Even if the VM is idle, licensed OS usage accumulates charges. |
Networking Services | Load balancers, NAT gateways, and Cloud CDN. | Separate charges: A global HTTP(S) load balancer can add $20-$50/month or more, depending on traffic. Ignoring these can make your bill feel unpredictable. |
Amnic Suggests: The VM hourly rate is only the starting point. Storage, network, accelerators, and OS licensing often make up a significant portion of your bill. Knowing the cost of each component is the first step toward predictable billing.
Machine Types: Where Most Confusion Begins
Google Compute Engine offers over 100 VM types, and selecting the wrong one can quickly inflate your cloud bill. Understanding machine families, their intended use cases, and cost implications is critical to avoid overspending.
Machine Family | Ideal For | Notes/Cost Considerations |
e2 | General-purpose workloads | Cost-efficient for development, testing, or small production workloads. E2 VMs are flexible and automatically adjust to your workload, making them a good starting point for most projects. |
n2/n2d | Balanced production workloads | Offers a mix of compute and memory resources, ideal for production apps that require steady performance. N2d uses AMD processors, which can sometimes reduce costs compared to N2. |
c2 | CPU-heavy workloads | Optimized for high-performance compute tasks such as simulation, analytics, and batch processing. These VMs are expensive, so use them only when you need raw compute power. |
m2 | Memory-intensive workloads | Suitable for in-memory databases or large caching workloads. Very high cost per VM, so ensure workloads truly need this much memory before provisioning. |
a2 | GPU workloads | Designed for AI/ML or GPU-heavy tasks. Adding even a single GPU can dramatically increase costs, so these should be used only when compute acceleration is required. |
Custom VMs
Custom VMs give you flexibility to configure exact CPU and memory requirements. While this can save money for highly specific workloads, it also increases the risk of over-provisioning, where you allocate more resources than needed, driving up costs unnecessarily.
Preemptible VMs
Preemptible VMs can offer up to 80% cost savings, but they can be terminated at any moment. They are best suited for stateless, fault-tolerant, or batch workloads, where sudden interruptions won’t impact critical services.
Tips for Choosing the Right Machine Family
Start small, scale smart: Begin with E2 or N2 families for general workloads, and right-size as usage patterns emerge.
Match machine type to workload: CPU-intensive apps → C2, memory-intensive → M2, AI/ML → A2.
Use monitoring and autoscaling: Track utilization to avoid over-provisioning and dynamically scale resources.
Combine custom and preemptible VMs wisely: Use custom VMs for specialized workloads, and preemptible VMs for batch jobs to save money.
Discounts That Actually Save You Money
Google Cloud provides several ways to save on GCE costs, but understanding how each works is crucial to avoid missteps. Let’s break them down:
Discount Type | Potential Savings | How It Works/Tips |
Sustained Use Discounts (SUD) | Up to 30% | Automatically applied when a VM runs for a significant portion of the month (typically >25%). No setup required, savings increase as usage grows. Amnic suggests: Track VM uptime; if a VM runs only sporadically, you might miss out on SUD benefits. |
Committed Use Discounts (CUD) | Up to 70% | You commit to using a specific resource (CPU/memory) for 1-3 years. Best for predictable workloads like production apps. Amnic suggests: Commit to resources, not spend. Resource-based commitments are safer than spend-based because they align with actual usage. |
Preemptible VMs | Up to 80% | Short-lived, low-cost instances ideal for batch processing, testing, or fault-tolerant workloads. Caution: Preemptible VMs can be terminated at any time, so they’re unsuitable for critical applications. |
Key Takeaway: Discounts can be powerful, but only if used strategically. Blindly committing to resources or miscalculating uptime can reduce savings or even increase costs.
Hidden Costs You Might Be Ignoring
Even when you right-size VMs and apply discounts, there are “sneaky” charges that silently inflate your bill. Here’s what to watch for:
Idle VMs and unattached disks: Many teams stop using a VM but leave it running or forget about persistent disks. These idle resources continue to accrue charges, sometimes hundreds of dollars per month.
Static external IPs: Reserved but unused IP addresses are not free. Leaving them unattached can quietly add to your network costs.
Cross-region data transfer: Sending data between regions or zones incurs additional egress fees. Even small microservices communicating across regions can cause unexpected spikes in your bill.
Load balancers and NAT gateways: Essential for traffic routing and connectivity, but charges scale with usage. Ignoring them can make your network costs feel unpredictable.
Snapshots and backups: Snapshots grow over time, especially if old versions aren’t deleted. A few gigabytes may seem cheap initially, but accumulated snapshots can cost hundreds of dollars per month.
Premium OS images (Windows, RHEL, SUSE): Charged per vCPU per hour, these licenses add extra cost even if the VM is idle. Many teams forget to account for OS licensing in their budgeting.
Pro Tip: Conduct a monthly audit of idle resources, snapshots, and network services. Even small optimizations can reduce cloud spend by 10-20% without touching workloads.
Cost Allocation Challenges
Understanding who or what is responsible for cloud spend is critical for controlling costs. Without a clear strategy, billing data can become messy and difficult to act on.
Tool | Purpose/How It Helps |
Labels (tags) | Assign costs to specific teams, projects, or services. Labels help finance and engineering teams understand which workloads are driving spend. |
Folders/Projects | Organize resources logically to group related workloads or business units. Helps in managing budgets for different departments or environments. |
Billing Export | Export GCP billing data to BigQuery for deep analysis. Enables custom reports, trend analysis, and cost allocation per team, project, or environment. |
Common Challenges
Labels aren’t enforced → missing metadata
Many teams forget to consistently apply labels. Without them, shared resources like databases or storage volumes appear under “miscellaneous,” hiding actual usage and costs.
Shared services are hard to allocate
Services like Kubernetes clusters, NAT gateways, or VPCs are used by multiple teams. Assigning cost fairly can be challenging without clear tagging or allocation rules.
Multi-project architectures obscure spend
Large organizations often have multiple projects for isolation or compliance. Tracking total cost per team becomes difficult when data is fragmented across projects.
Tip: Set up mandatory labeling policies and automate tagging wherever possible to ensure all costs are traceable.
Practical Strategies to Reduce GCE Costs
Even with cost allocation in place, teams often overspend due to inefficient resource usage. Here are actionable strategies:
1. Compute Optimization
Right-size VMs using CPU and memory utilization metrics. Avoid over-provisioning; smaller VMs or fewer CPUs often suffice.
Move non-production workloads to the E2 family, which offers cost-efficient general-purpose VMs.
Enable autoscaling with managed instance groups to dynamically adjust capacity based on real-time demand.
Use Spot (Preemptible) VMs for batch jobs, testing, or fault-tolerant workloads to save up to 80% on compute costs.
2. Storage Optimization
Delete unattached disks, orphaned storage often costs more than active compute in some setups.
Use standard PDs instead of SSD PDs unless high IOPS is required. SSDs are expensive and often unnecessary for development or test workloads.
Implement snapshot retention policies to automatically delete old backups. This prevents snapshot bloat, which can silently increase monthly bills.
3. Networking Optimization
Minimize cross-zone and cross-region traffic, as egress fees can be substantial. Consider architecture changes like collocating services in the same region.
Use Cloud CDN to cache content closer to users and reduce egress from origin servers.
Regularly review NAT gateways and load balancer usage, ensuring you aren’t paying for idle or underutilized network services.
Improving GCE Cost Visibility
Cloud cost visibility is key, you can’t optimize what you can’t see. A few practices make a big difference:
Enforce auto-labeling rules: Automate labels at VM creation to track cost by team, environment, or project. This eliminates manual errors and missing metadata.
Monitor idle resources regularly: Identify idle VMs, unattached disks, or unused snapshots and clean them up before they accumulate unnecessary costs.
Analyze CPU/memory usage for right-sizing: Use metrics to adjust VM types and sizes. For instance, a VM that averages 30% CPU usage could be downsized to save 20-30% of its cost.
Build custom dashboards for compute and network costs: Visualizing costs in dashboards makes trends and anomalies easy to spot. Track VM usage, network egress, storage, and high-cost resources in a single view.
Tip: Regular cost audits (monthly or quarterly) combined with dashboards help teams spot issues early and avoid surprise spikes on billing day.
Quick GCE Cost Control Checklist
Use this checklist to quickly audit your GCE resources and identify potential cost savings.
Check | Status |
Are all VMs labeled? | ☐ |
Any idle VMs or disks? | ☐ |
Discounts applied? | ☐ |
Right machine types selected? | ☐ |
Network egress monitored? | ☐ |
Snapshots cleaned up? | ☐ |
In a nutshell
Google Compute Engine offers immense flexibility, but that power comes with complexity. Unmonitored VMs, hidden network charges, and misapplied discounts can quickly inflate your bill, often before you even notice.
By breaking down costs across compute, storage, and network, applying discounts wisely, and enforcing consistent labeling, you gain full visibility and control over your GCE spend.
With the right practices in place, your cloud bill stops being a guessing game. Instead, it becomes a predictable, manageable tool that supports smarter budgeting, cost-efficient scaling, and better business decisions, all while letting you focus on what really matters: building and improving your products.
With Amnic, you don’t just see what you’re paying, you understand why, and you get clear next steps on how to optimize.
[Request a demo and speak to our team]
[Sign up for a no-cost 30-day trial]
[Check out our free resources on FinOps]
[Try Amnic AI Agents today]
There is so much you can do with Amnic. Explore Amnic’s other capabilities:
Cost Allocation & Unit Economics: Allocate cloud costs to products, services, teams, BUs, customers, and applications, to create business-level views of COGS, resources, and other parameters.
Kubernetes Observability: Understand and allocate Kubernetes utilization better at a container, pod, instance, PVC, and DNS level and gain recommendations to rightsize clusters and lower overall costs.
Reporting and Custom Views: Simplify the hours it takes to build complex reports on cloud costs. Create, schedule, and automate reports with a few simple clicks.
Recommendations and Anomalies: Cost mitigation recommendations molded on leading cloud providers. Get alerts for anomalies and surprise costs.
Budgeting & Forecasting: Plan, budget, and forecast cloud expenses across teams and projects.
Frequently Asked Questions
1. What are the main components that make up Google Compute Engine costs?
GCE costs are primarily driven by your VM’s vCPU and memory usage, but other components like persistent disks, network egress, GPUs, OS licenses, and load balancers also add up. Many teams underestimate how much storage and data transfer can influence their total bill.
2. Why does my Google Cloud bill keep increasing even when I haven’t changed my workloads?
This usually happens because of idle or forgotten resources, such as unattached disks, static IPs, or snapshots. that continue to accrue charges. Other culprits include cross-region traffic, autoscaling misconfigurations, or missing discounts like Sustained Use or Committed Use.
3. How can I reduce my GCE costs without affecting performance?
Start by right-sizing your VMs using usage metrics, move non-production workloads to cost-efficient machine types like E2, delete idle resources, and apply sustained or committed use discounts strategically. Regularly auditing storage and network usage also prevents silent overspend.
4. What’s the difference between Sustained Use Discounts (SUD) and Committed Use Discounts (CUD)?
SUDs are automatic and apply when a VM runs for a large portion of the month (no commitment needed).
CUDs require a 1–3 year commitment but offer deeper discounts.
The key is to commit to resources, not just spend, ensuring you’re saving on actual usage rather than locking in unnecessary capacity.
5. How do I track which team or project is responsible for cloud spend?
Use labels (tags) and organize resources into projects and folders. You can also export billing data to BigQuery for custom cost analysis. Enforcing auto-labeling ensures all new resources are traceable, making cost allocation much simpler for both finance and engineering teams.
6. What tools or practices can help improve GCE cost visibility?
Set up dashboards to visualize compute, storage, and network costs. Combine this with automated labeling, anomaly detection, and regular cost audits. Tools like Amnic can simplify this by offering unified dashboards and insights that make cost trends, anomalies, and optimization opportunities easier to spot.
Recommended Articles
Better visibility and management into AI Tokens?
Start with a 30 day trial
Connect leading LLMs
24 hour time to value
Stay ahead of AI Spend

Make AI spend visible, controllable, and accountable.
Gain insights into your AI token costs at a team, customer, business unit and individual user level to measure and manage AI utilization.
Recommended Articles

AWS EC2 Costs Explained: What You're Actually Billed For
Read More

6 Best GCP Cost Optimization Tools in 2026
Read More
GCP CUD vs. SUD: How to Choose the Right Discount Strategy
Read More

Breaking Bill: Breaking Down Google Cloud Storage Billing
Read More

Breaking Bill: Breaking Down Azure Virtual Machine Pricing Models
Read More

Breaking Bill: Making Sense of Your Azure Blob Storage Bill
Read More


