Context Graphs: The $1 Trillion AI Backbone Enterprises Can't Ignore in 2026
15 min read
General

Table of Contents
Context graphs are 2026's hottest AI conversation. Foundation Capital calls them a trillion-dollar opportunity. Substack authors predict they'll redefine enterprise workflows. LinkedIn feeds buzz with "the USB-C of AI applications." But beneath the hype lies a simple, profound shift.
In 2026, artificial intelligence is no longer just about models, parameters, or compute power. While large language models (LLMs) and foundation models have captured headlines, a quieter but more powerful shift is happening behind the scenes: the rise of context graphs.
Context graphs are becoming the invisible backbone that allows AI systems to reason, personalize, adapt, and operate reliably inside enterprises. They connect data, users, processes, and business logic into a living, evolving knowledge structure. Without them, even the most advanced AI remains shallow, inconsistent, and unreliable.
Current systems record "what" happened. Context graphs capture "why." Let’sl unpack what context graphs really are, why they're exploding now, their trillion-dollar market potential, and, most importantly, how FinOps and cloud leaders can leverage them for 30%+ savings in 2026.
What Are Context Graphs?
At their core, context graphs are structured representations of relationships between entities, data, events, and intentions within a system.
They go far beyond traditional databases or knowledge graphs by continuously capturing:
Who is interacting with the system
What data is being used
Why a request is being made
How it relates to business goals
When and where it happens
In simple terms, a context graph is the memory and reasoning layer for AI. It helps AI systems understand not just information, but meaning.
Imagine an enterprise AI assistant used for cloud cost management. A traditional system may know:
AWS account ID
Monthly spend
Cost centers
A context graph knows:
This request is from a FinOps manager
During budget planning season
Related to Project X
Impacting customer onboarding
With a risk of overspending
Under current CFO constraints
This rich web of connections allows the AI to respond intelligently, not generically.
Let's strip away the buzzwords. Context graphs evolve knowledge graphs into living decision memory.
text
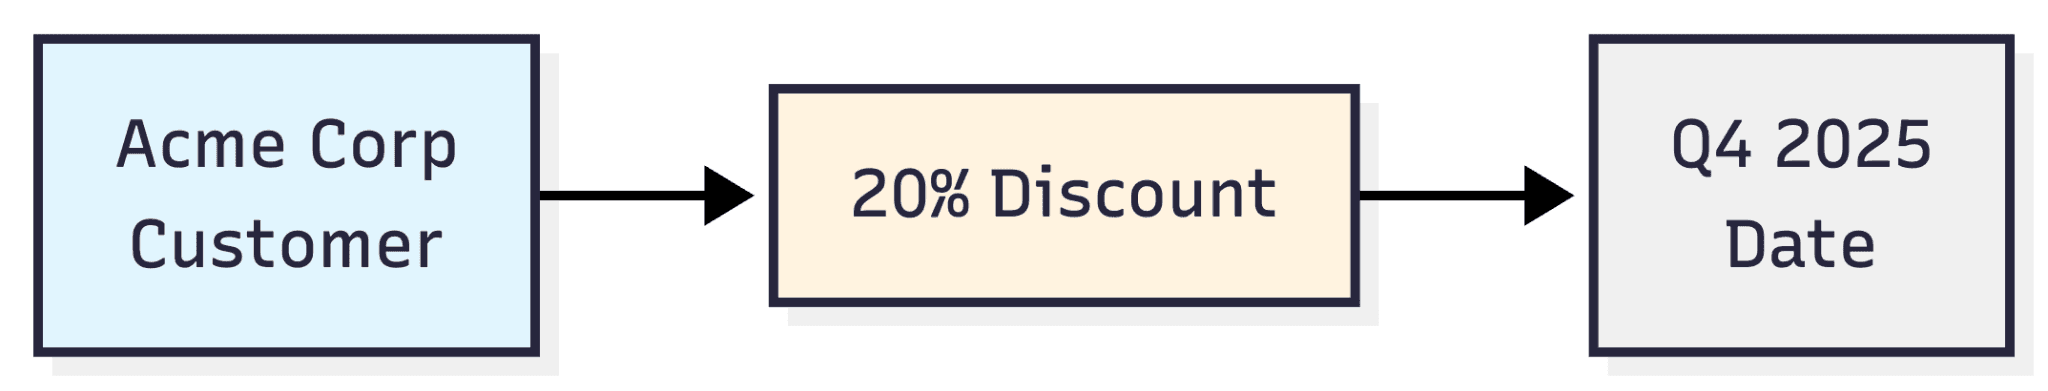
Traditional Knowledge Graph:
[Customer: Acme Corp] → [Discount: 20%] → [Date: Q4 2025]
Context Graph:
[Customer: Acme Corp]
├── [Churn Risk: 3mo ARR decline 15%]
├── [Precedent: Similar case Q3 2025, VP override]
├── [Constraint: Max 25% w/o CRO approval]
├── [Decision Maker: Regional VP Sarah]
└── [Outcome: +6mo contract, 110% renewal]
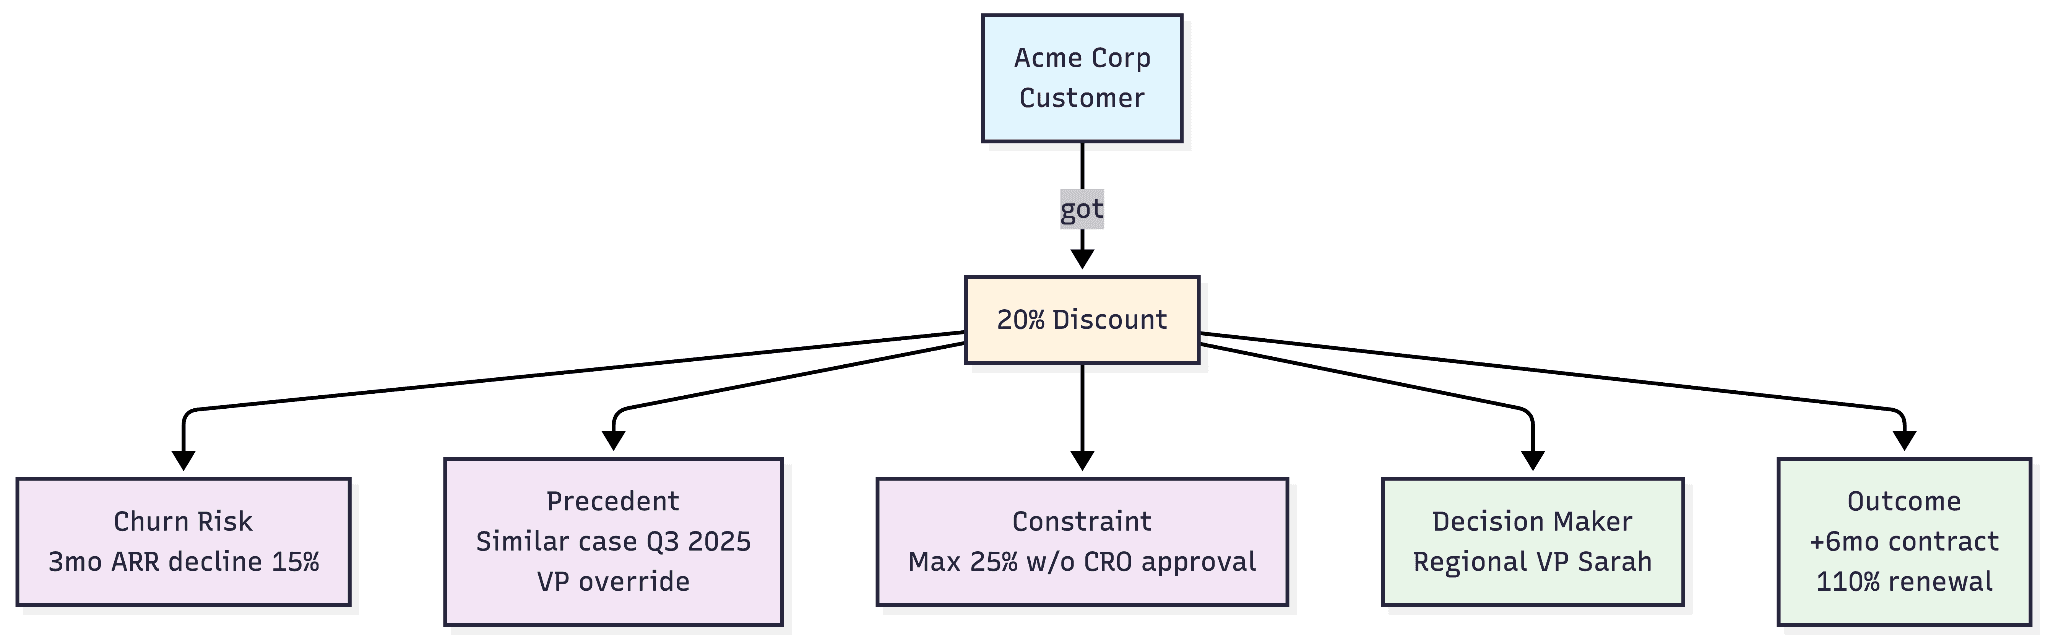
Nodes = entities (customers, resources, people, decisions).
Edges = causal relationships, temporal context, precedents, constraints.
Every decision here compounds intelligence. Your AI doesn't just know what you did, it knows why, when conditions matched, and what happened next.
Analogy: If spreadsheets track transactions and knowledge graphs are phonebooks (who + what), context graphs are detective case files (who + what + why + outcomes + patterns).
Context Graphs vs Traditional Knowledge Graphs
Let’s give it more depth. Context graphs are often confused with knowledge graphs, but they serve different purposes. To understand the distinction, it’s important to first look at what knowledge graphs are and why they became popular.
What are Knowledge Graphs?
A knowledge graph is a structured representation of facts, entities, and their relationships. It organizes information in the form of nodes (entities) and edges (relationships) to help systems understand "what exists" and "how things are connected."
In enterprises, knowledge graphs typically capture:
Customers, products, and vendors
Employees and departments
Applications and services
Locations and assets
Policies and documents
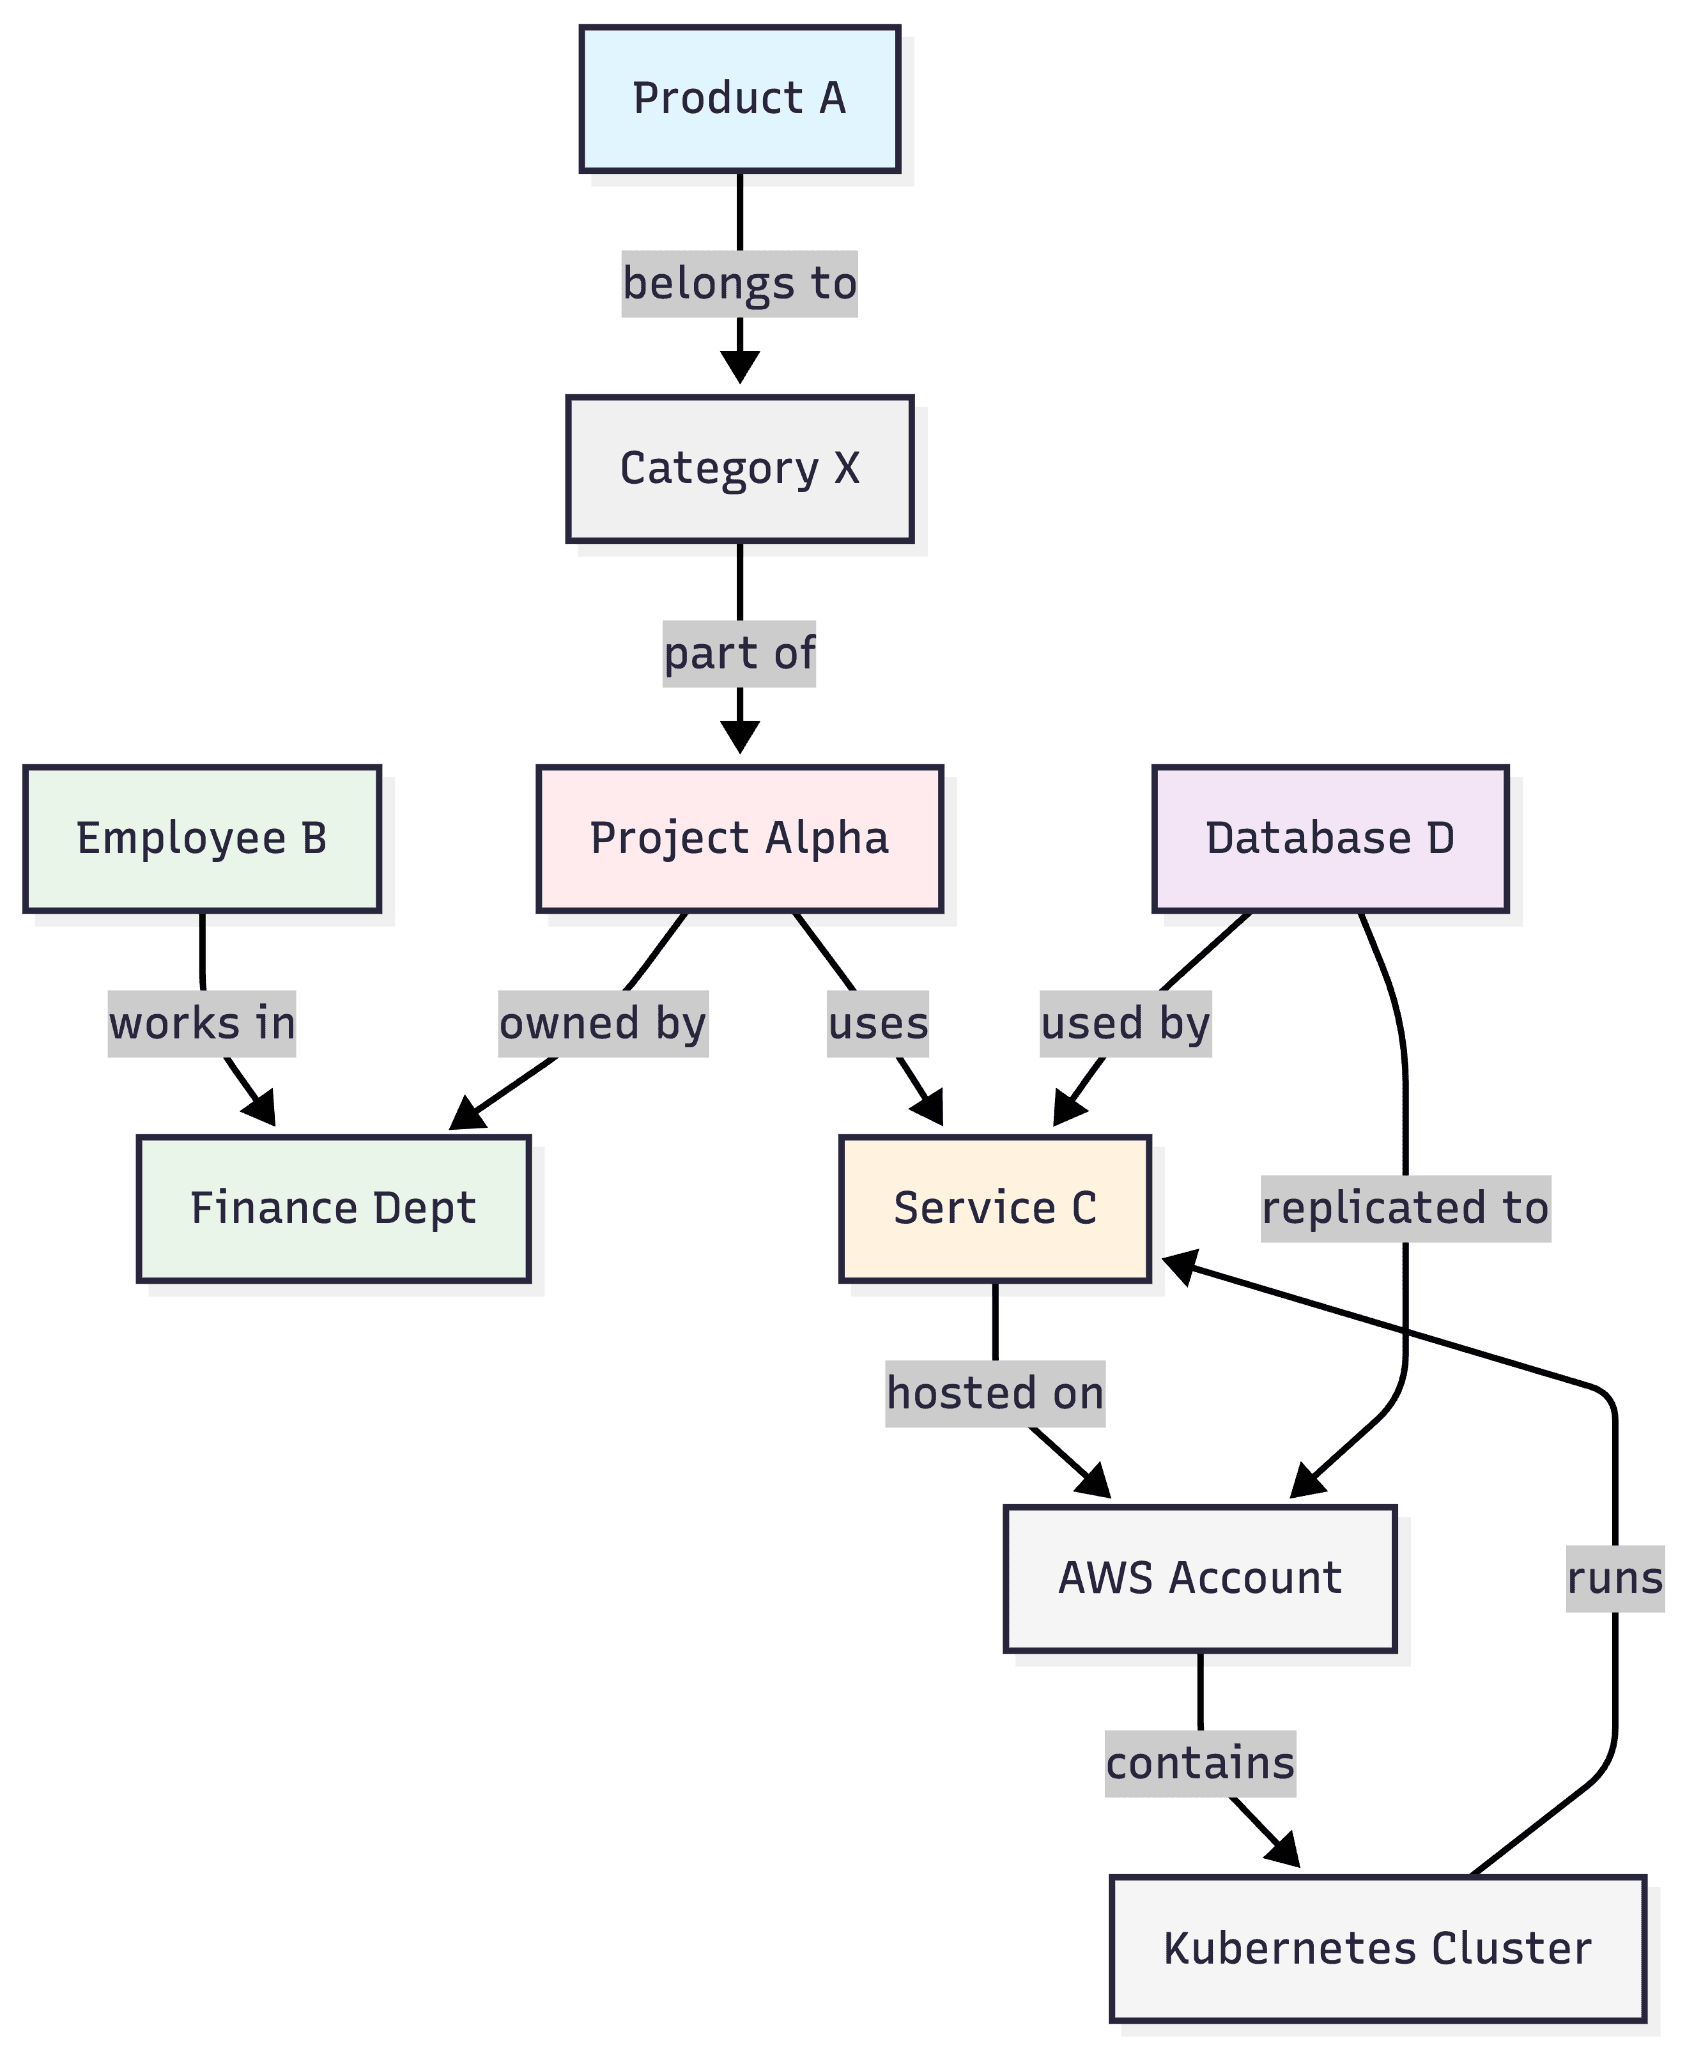
For example, a knowledge graph may store facts like:
Product A → belongs to → Category X.
Employee B → works in → Finance Dept.
Service C → is hosted on → AWS Account.
AWS Account → contains → Kubernetes Cluster.
Kubernetes Cluster → runs → Service C.
Project Alpha → uses → Service C.
Project Alpha → is owned by → Finance Dept.
Category X → is part of → Project Alpha.
Database D → is used by → Service C.
Database D → is replicated to → AWS Account.
These graphs are primarily designed to answer factual questions and improve search, discovery, and data integration.
They are widely used in:
Search engines
Recommendation systems
Master data management
Enterprise knowledge bases
Content management platforms
However, most knowledge graphs are relatively static. They change when underlying data changes, but they do not deeply model real-time intent, situational context, or business priorities.
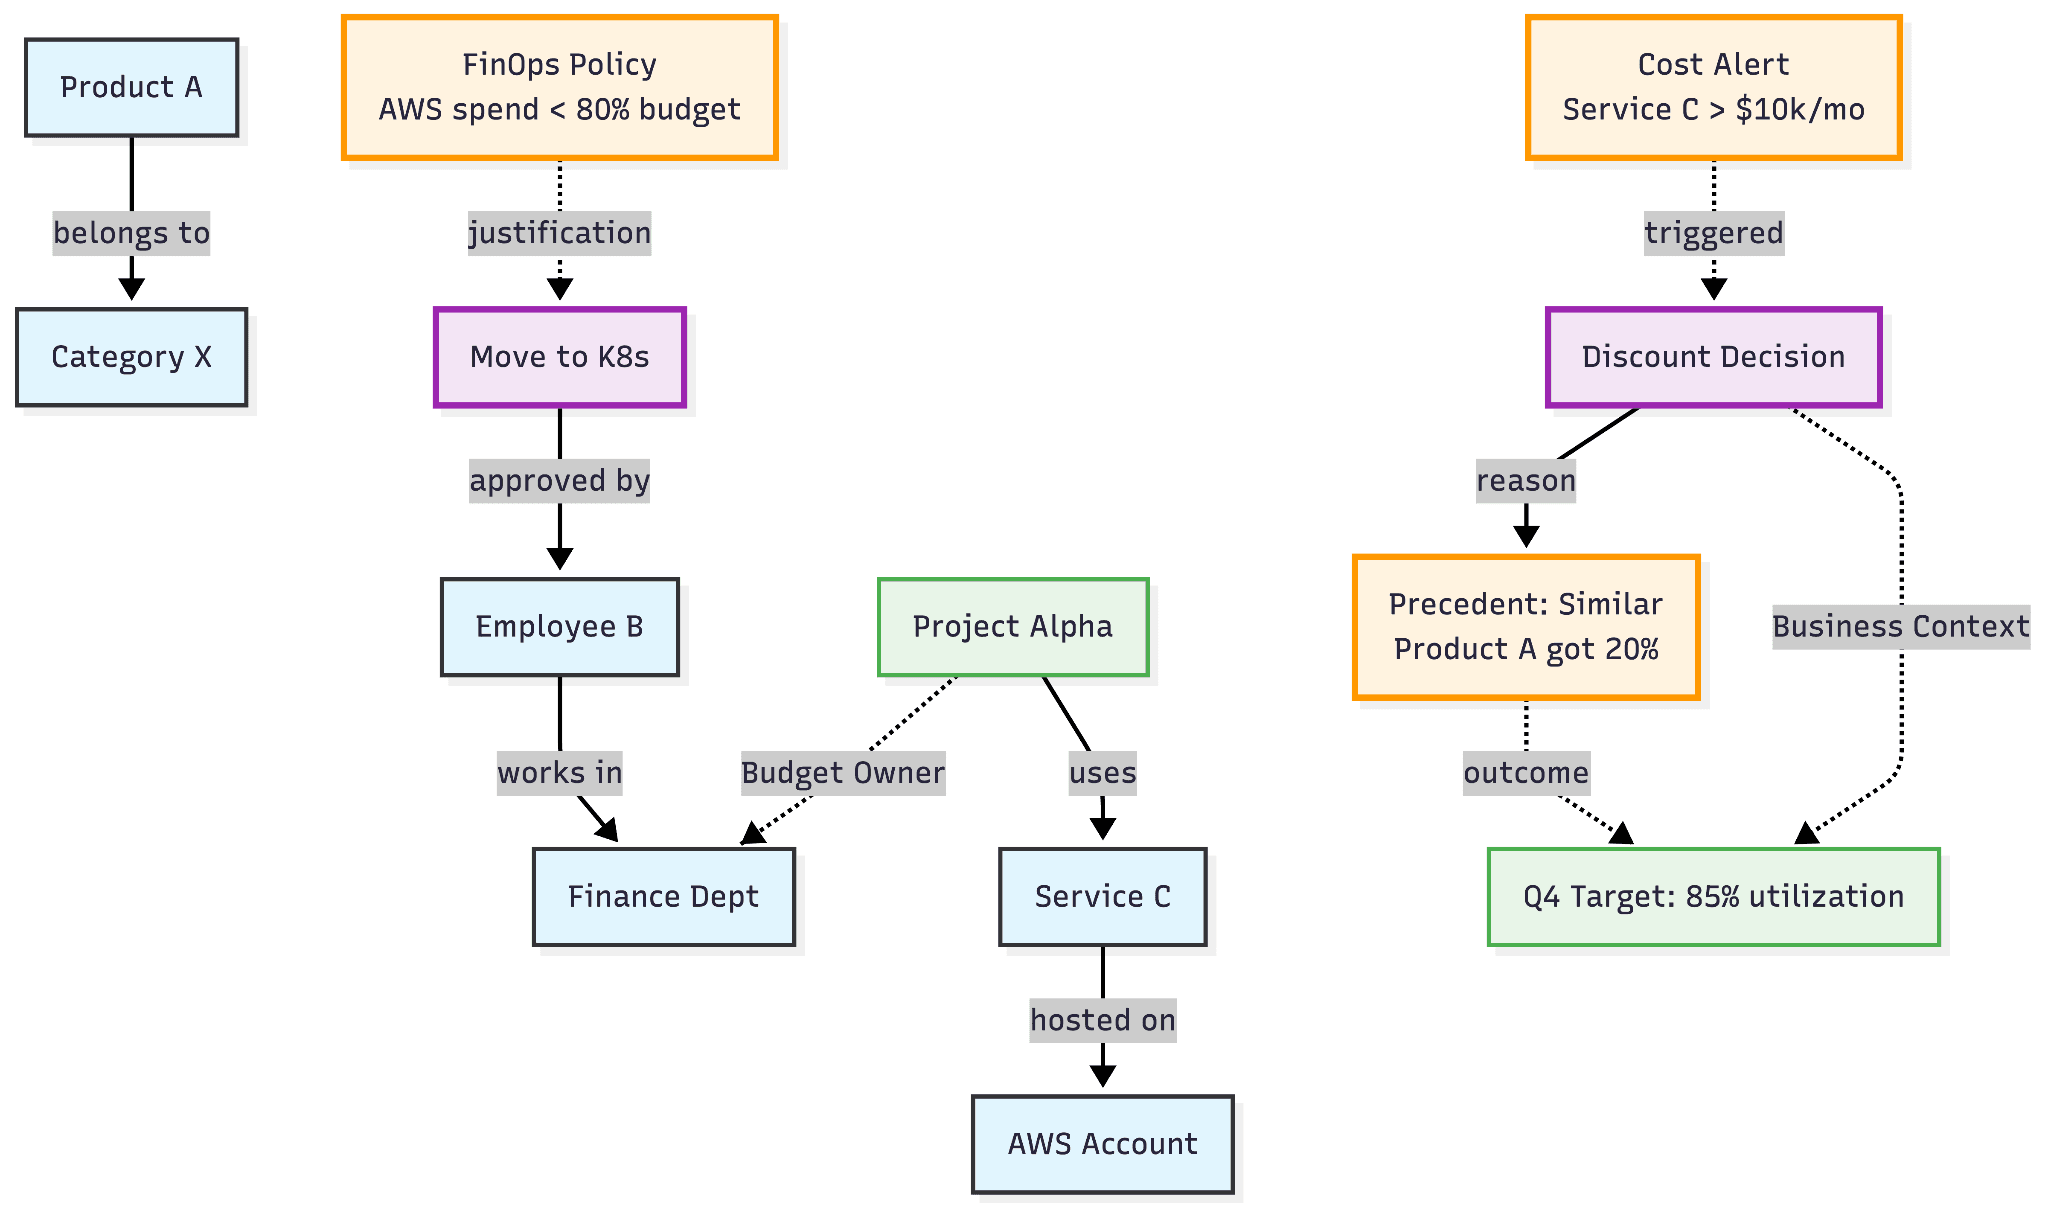
How Context Graphs Go Beyond Knowledge Graphs
While knowledge graphs focus on storing structured facts, context graphs focus on understanding meaning, relevance, and intent in real time.
They extend traditional knowledge graphs by adding:
User intent
Temporal signals
Behavioral patterns
Business constraints
Risk indicators
Operational priorities
In other words, knowledge graphs answer:
“What is true?”
Context graphs answer:
“What matters right now, and why?”
Referring to the previous example, a context graph pf the same would look like this:
Knowledge Graph Vs. Context Graph: Key Differences at a Glance
Feature | Knowledge Graph | Context Graph |
Focus | Facts and entities | Relationships + intent |
Nature | Mostly static | Continuously evolving |
Usage | Search, lookup | Reasoning, decision-making |
Personalization | Limited | Deep and dynamic |
Temporal Awareness | Low | High |
How Context Graphs Work
A modern context graph system typically consists of five layers.
1. Data Ingestion Layer
This layer connects to multiple sources:
Cloud platforms
SaaS tools
CRM and ERP systems
Data warehouses
Logs and telemetry
User interactions
It continuously streams structured and unstructured data into the system.
2. Entity Extraction and Normalization
Here, raw data is transformed into entities such as:
Users
Teams
Applications
Resources
Costs
Contracts
SLAs
AI and NLP models help identify and normalize these entities.
3. Relationship Modeling
This layer builds relationships between entities:
User → owns → Budget
Service → supports → Product
Team → depends on → Infrastructure
Cost → impacts → Margin
These relationships form the graph structure.
4. Context Enrichment
Context is added through:
Historical patterns
Real-time signals
Business rules
Policies
Risk models
Behavioral data
This is what makes the graph dynamic and situational.
5. Reasoning and Retrieval Layer
Finally, AI models query the context graph to:
Retrieve relevant information
Prioritize signals
Apply constraints
Generate recommendations
Explain decisions
This layer enables trustworthy AI behavior.
Why Context Graphs Are Exploding in 2026
The rapid rise of context graphs is not accidental. It is driven by a convergence of structural changes in how enterprises use AI, data, and automation. Five forces, in particular, explain why 2026 is the inflection point.
1. AI and Agents Have Hit the "Context Wall"
Modern LLMs and AI agents are powerful, but they fail without reliable grounding.
Without structured context:
Models hallucinate
Agents repeat past mistakes
Recommendations ignore constraints
Decision history is lost
Trust erodes
Context graphs provide persistent memory and situational awareness. Every rightsizing decision, budget exception, migration outcome, and vendor negotiation becomes searchable, reusable precedent. This turns AI from a reactive tool into a learning system.
2. Enterprise Decision-Making Is Fragmented
In most organizations, no single system owns "why" a decision was made.
Context is scattered across:
CRM systems (customer context)
Ticketing tools (incident reasoning)
Slack and chats (tribal knowledge)
Finance systems (budget constraints)
Email threads (approvals)
Context graphs unify these silos into causal, traceable webs of reasoning. Instead of isolated data points, leaders get connected decision narratives.
3. Manual Judgment No Longer Scales
Teams like FinOps, IT, and operations repeat the same analysis every cycle.
For example:
Q1: Spot vs. On-Demand tradeoffs
Q2: Multi-region data movement costs
Q3: Graviton migration outcomes
Q4: Kubernetes namespace optimization
Without context reuse, every quarter starts from scratch.
With context graphs, teams can query:
"Repeat Q2 Spot strategy where conditions match"
and instantly reuse validated reasoning, cutting decision cycles by up to 80%.
4. Compliance and Governance Require Explainability
Regulators and auditors increasingly demand:
Traceable decisions
Auditable workflows
Transparent AI behavior
Clear accountability
Questions like:
"Why was a $200k Spot commitment approved?"
can no longer be answered with spreadsheets or intuition.
Context graphs preserve complete reasoning chains, enabling safer automation and defensible compliance.
5. Autonomous Systems Need Shared Intelligence
As enterprises deploy multiple AI agents across finance, engineering, security, and operations, coordination becomes critical.
Without shared context:
Agents conflict
Policies drift
Optimization breaks down
Context graphs act as a common intelligence layer, ensuring that autonomous systems operate with the same understanding of priorities, risks, and constraints.
They transform disconnected agents into coordinated digital teams.
The 7 Reasons Why Context Graphs are Unmissable
1. They Fix AI’s Fatal “What vs Why” Blindspot
Most enterprise systems today capture what happened, but rarely why it happened.
A traditional system might record:
“EC2 cluster resized from m5.8xlarge → 25% cost savings.”
A context graph preserves the reasoning behind that decision:
Why resized:
├── Latency SLO breach (P95 → 450ms)
├── Competitor benchmarking (API gateway patterns)
├── Capacity forecast (Black Friday +20%)
└── Precedent match (Q3 e-commerce resize)
This turns isolated metrics into institutional knowledge.
As a result, AI agents learn from real business conditions, edge cases, and trade-offs, not just averages. The familiar excuse, “this workload is different,” becomes far less common.
2. They Turn Tribal Knowledge into Searchable Precedent
In most enterprises, critical decisions live in Slack threads, emails, and meeting notes. When teams need to repeat a successful strategy, they rely on memory and manual digging. With context graphs, future FinOps agents can query past decisions directly:
MATCH (decision:Rightsizing)-[:PRECEDENT_FOR]->(similarWorkload)
WHERE decision.savings > 20% AND similarWorkload.type = "API gateway"
RETURN decision.reasoning, decision.outcome, decision.slo_impact
Instead of “Slack archaeology,” teams get instant access to proven playbooks.
Knowledge stops walking out the door. It becomes a permanent organizational asset.
3. They Convert Informal Exceptions into Scalable Policy
Every organization runs on unwritten rules.
For example:
“Give 25% discounts to strategic accounts with 12+ months of history.”
Today, these are handled through repeated manual exceptions. Over time, context graphs reveal these hidden patterns.
When 80% of “special cases” follow the same logic, they can be formalized into policies. Agents can then execute them autonomously, with guardrails.
The result is less bureaucracy, faster execution, and more consistent governance.
4. They Enable Cross-System Reasoning Without Hallucinations
Enterprise decisions rarely live in one system.
A real cost spike might involve:
Cost spike → Kubernetes namespace → Pod spec →
Deployment trigger → Feature flag → Slack discussion →
Business justification → Approved exception →
Budget owner signoff → Finance allocation
Without unified context, AI models guess.
With context graphs, agents traverse the entire decision lineage across CRM, ticketing, finance, and collaboration tools.
This grounding dramatically reduces hallucinations and enables reliable, end-to-end reasoning.
5. They Create Compound Intelligence Through a Learning Flywheel
Every decision an organization makes contains learning. Most of it is lost.
Context graphs turn decisions into building blocks of intelligence:
Every decision = +1 node, +3–5 edges
Year 1: 10K decisions → 40K relationships
Year 3: 100K decisions → 400K relationships
Over time:
Patterns emerge
Causal links become visible
Predictive models become possible
Your AI systems get smarter as your business grows. This creates a defensible, compounding advantage that competitors cannot copy overnight.
6. They Enable Auditable Autonomy at Enterprise Scale
As AI agents gain autonomy, governance becomes the biggest concern.
Executives and regulators will ask:
“Why did an agent approve a $500k GPU commitment?”
A context graph provides the full reasoning trail:
Commitment → [Business need: Training deadline]
→ [Precedent: Q3 model, 30% faster convergence]
→ [Budget: AI envelope, 75% utilized]
→ [Approver: Platform Lead]
→ [Fallback: Manual review >90%]
Instead of opaque decisions, organizations get transparent, defensible automation. This makes large-scale autonomy safe, compliant, and board-ready.
7. They Multiply FinOps Impact Through Decision Memory
Cloud cost decisions compound over time:
Q1: Spot vs On-Demand
Q2: Multi-region tradeoffs
Q3: Graviton migration
Q4: Kubernetes optimization
Without structured memory, teams repeat the same analysis every cycle.
With context graphs, past strategies become reusable assets:
“Execute Q2 Spot strategy where P95 latency <300ms and churn risk >15%.”
Instant playbooks replace manual reinvention.
FinOps evolves from reactive optimization to systematic, compounding intelligence.
The $1 Trillion Opportunity
Context graphs sit at the intersection of:
Enterprise software
AI infrastructure
Data platforms
Automation systems
They power:
AI copilots
Autonomous workflows
Decision engines
Digital twins
Enterprise operating systems
As every major SaaS and cloud provider embeds context layers, market value compounds rapidly.
Analysts project that platforms built on context intelligence will define the next generation of enterprise winners.
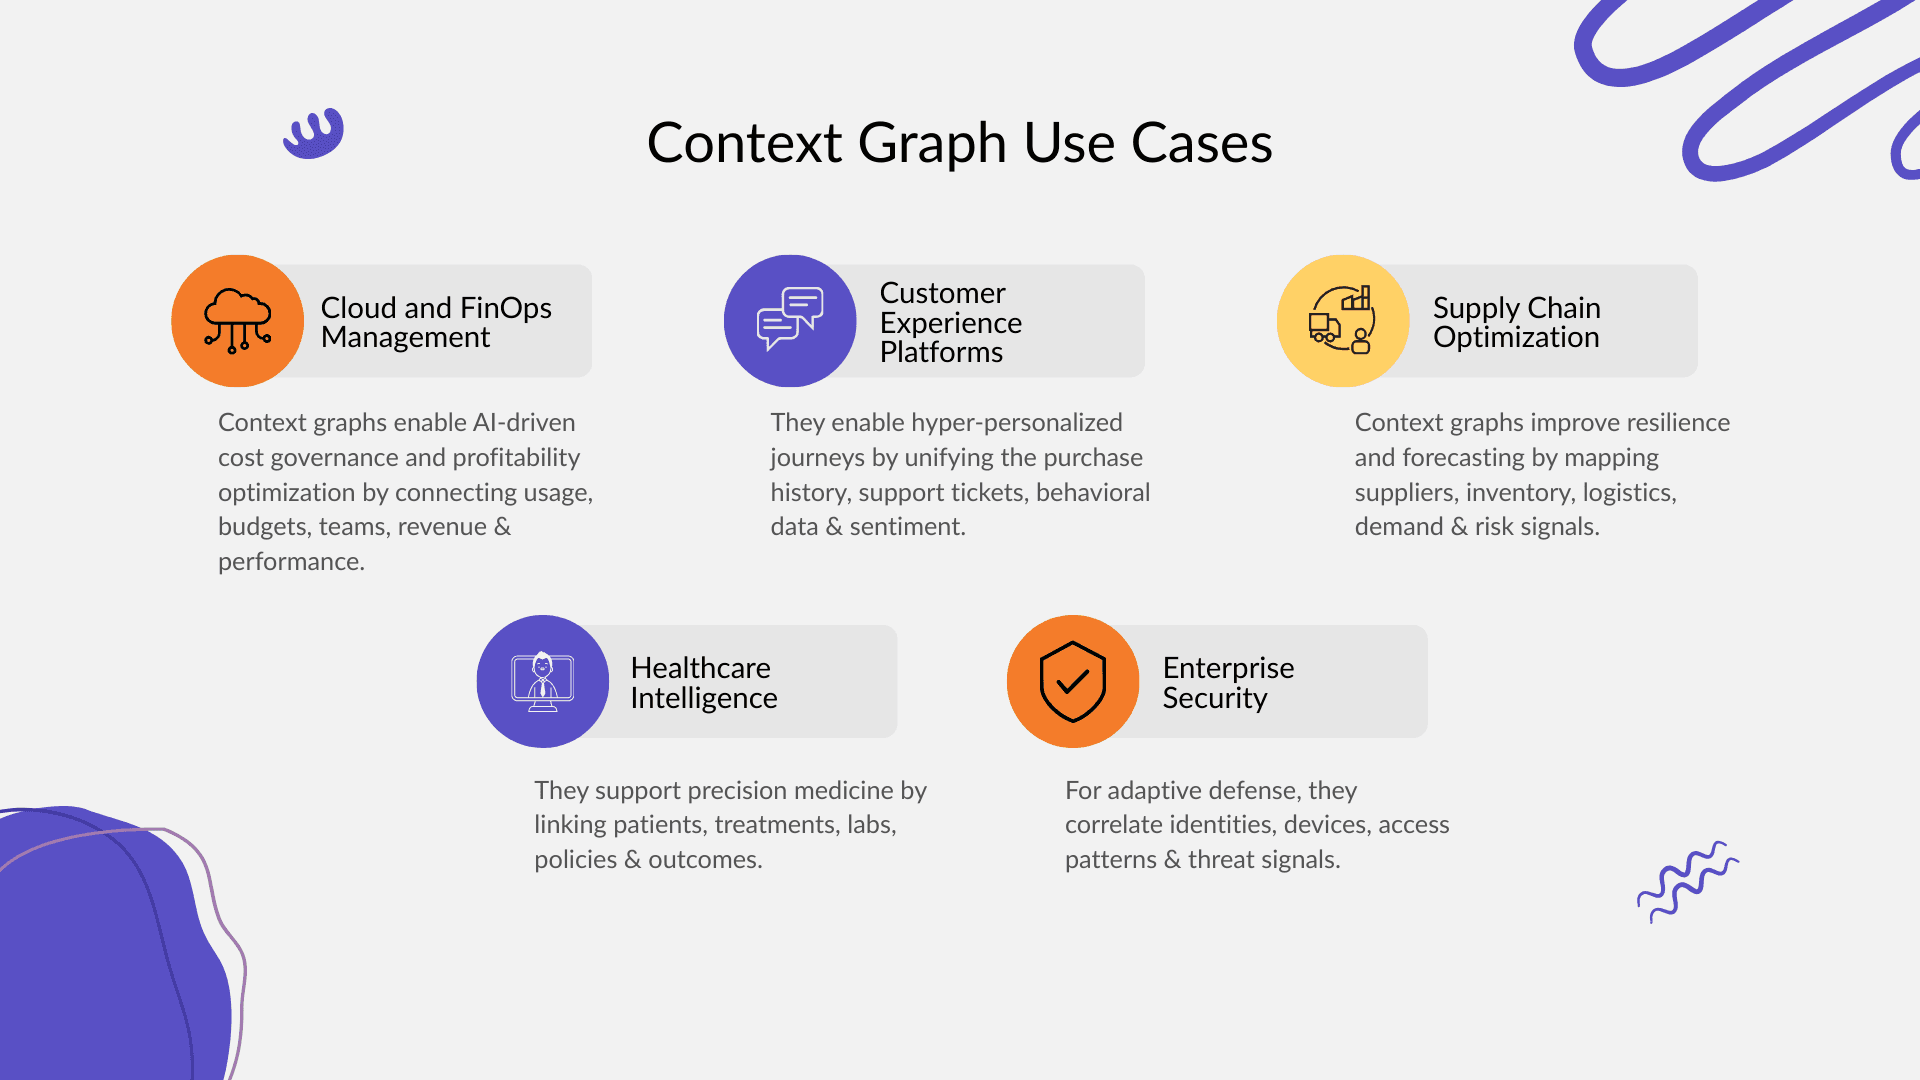
Key Use Cases of Context Graphs Across Industries
Cloud and FinOps Management
Customer Experience Platforms
Supply Chain Optimization
Healthcare Intelligence
Enterprise Security
Building Context Graphs: A Practical Framework for Enterprises
Building a context graph is not a one-time project. It is an ongoing capability that evolves with your business. The most successful organizations approach it systematically, starting small and scaling with impact.
Below is a practical, six-step framework to get started.
Step 1: Identify High-Value Domains
Not every business area needs a context graph on day one. Start where missing context is already expensive. The idea of starting with workflows where “missing context is expensive” aligns with how context graphs emerge in practice, by capturing decision traces in exception-heavy domains.
Look for domains with:
Repeated cost overruns
Persistent customer churn
Frequent compliance escalations
Manual approval bottlenecks
Operational delays
High executive visibility
In most enterprises, early high-impact domains include:
Cloud and FinOps management
Revenue and pricing operations
Customer support and retention
Supply chain planning
Security incident response
The goal is to focus on decisions that are:
Repeated often
Risk-sensitive
Hard to standardize
Dependent on many systems
These domains deliver the fastest ROI from contextual intelligence.
Step 2: Define Core Entities and Ownership
Once a domain is selected, the next step is to define what “matters” inside it. This means identifying core entities and their owners. Entities such as users, assets, budgets, and workflows are nodes in graph structures that make context graph reasoning possible. Traditional knowledge graphs model entities and relationships; context graphs extend this with operational context.
Typical entities include:
People: users, approvers, managers
Assets: cloud resources, applications, models
Financial objects: budgets, contracts, invoices
Processes: workflows, approvals, deployments
Outcomes: savings, incidents, churn events
For example, in FinOps:
Workload
Account
Budget
Cost center
Application owner
Revenue stream
Each entity should have:
A clear definition
A unique identifier
An accountable owner
This prevents the graph from becoming an unstructured data swamp. Good context graphs start with disciplined modeling.
Step 3: Establish Reliable Data Pipelines
Context is only as good as the data behind it. Enterprises must build pipelines that continuously feed the graph from operational systems. Context graphs need decision traces and provenance flowing from operational systems into the graph so AI agents can access them.
These typically include:
Cloud platforms (AWS, Azure, GCP)
SaaS tools (CRM, ERP, ticketing)
Collaboration tools (Slack, email)
Observability systems
Data warehouses
Event streams
Two types of ingestion matter:
Batch ingestion
Historical data
Contracts
Past decisions
Archived tickets
Real-time ingestion
Usage spikes
Policy violations
Approvals
Incident alerts
Modern context graphs combine both. This ensures the graph reflects both long-term history and current reality.
Step 4: Design Relationship Models
A key distinction between context graphs and other graph models is that they encode decision lineage and semantics, not just static relationships, and make them queryable for AI.
Key relationships include:
Ownership: who is responsible
Dependency: what relies on what
Impact: what affects outcomes
Approval: who authorized what
Precedence: what influenced decisions
Constraints: policies and limits
Examples:
Service → depends on → Database
Budget → constrains → Project
Incident → impacts → Revenue
Manager → approved → Exception
Migration → influenced → Cost reduction
Over time, these relationships form decision pathways.
These pathways are what enable reasoning, simulation, and explanation.
Strong relationship design is the foundation of intelligent behavior.
Step 5: Integrate AI Reasoning Into Workflows
The real power of context graphs comes when they serve AI systems with structured context, not just store data. Modern enterprise AI patterns fuse context graphs with retrieval and agent frameworks.
Research shows that knowledge graph–based retrieval can improve AI accuracy by up to 35% on complex reasoning tasks. However, most knowledge graphs remain static and lack operational context such as lineage, policies, and usage patterns.
Context graphs close this gap by treating governance, ownership, quality signals, and operational metadata as first-class graph entities. A 2024 Cornell University study further shows that enriching graphs with temporal and provenance context significantly improves reasoning and question-answering performance.
Key integrations include:
Retrieval-Augmented Generation (RAG)
Agent planning systems
Recommendation engines
Workflow automation
Scenario simulators
Instead of asking an LLM:
“How can I reduce cloud costs?”
The system asks:
“Given my workloads, budgets, SLAs, past outcomes, and current risks, what should I do next?”
AI models query the graph to:
Retrieve relevant precedents
Apply business constraints
Compare similar situations
Explain recommendations
Flag anomalies
This is what transforms generic copilots into domain-aware agents.
Step 6: Implement Governance, Lineage, and Controls
At enterprise scale, unmanaged context becomes dangerous. Governance must be built into the graph from day one.
Key controls include:
Access Control
Who can view what relationships
Role-based visibility
Sensitive data masking
Lineage Tracking
Where data came from
How decisions were derived
Which systems contributed
Policy Enforcement
Budget limits
Approval thresholds
Risk tolerances
Regulatory constraints
Audit Trails
Decision history
Model inputs
Overrides and exceptions
This ensures:
Regulatory compliance
Trust in automation
Accountability
Safe scaling
Without governance, context graphs become black boxes. With it, they become enterprise-grade decision infrastructure.
Putting It All Together: Start Small, Scale Systematically
Most successful implementations follow this pattern:
Phase 1: Pilot
One domain
One workflow
One agent
Phase 2: Expansion
Multiple workflows
Cross-system context
Shared entities
Phase 3: Platform
Enterprise-wide graph
Multiple agents
Predictive intelligence
This phased approach minimizes risk and maximizes learning.
Challenges and Risks of Building Context Graphs
While context graphs unlock powerful capabilities, they are not plug-and-play infrastructure. Building and operating them at enterprise scale introduces real technical, organizational, and governance challenges.
Organizations that underestimate these risks often struggle to realize long-term value.
Understanding these obstacles early is essential for sustainable success.
1. Data Quality and Consistency Issues
Context graphs amplify both good and bad data.
If input systems contain:
Incomplete records
Inconsistent naming
Outdated ownership
Duplicate entities
Manual overrides
Those flaws propagate across the entire graph.
For example:
If a workload owner is incorrectly tagged, every downstream recommendation, approval, and budget allocation may be distorted. Unlike traditional dashboards, errors in context graphs affect reasoning itself. This makes data hygiene critical. Successful organizations invest in:
Automated validation
Continuous reconciliation
Master data management
Ownership enforcement
Exception monitoring
Without these safeguards, poor data quickly erodes trust in the system.
2. Organizational Silos and Political Friction
Context graphs require cross-functional participation. They connect finance, engineering, security, operations, and leadership into a shared intelligence layer. This often exposes:
Conflicting priorities
Inconsistent metrics
Hidden dependencies
Informal power structures
Some teams may resist sharing data or decision logic, fearing loss of control or accountability. For example:
Finance may hesitate to expose budget constraints. Engineering may resist external oversight of deployments.
Without executive sponsorship and clear governance, context initiatives stall. High-performing organizations address this by:
Establishing cross-functional councils
Defining shared success metrics
Aligning incentives
Making transparency a leadership mandate
Context is as much a cultural shift as a technical one.
3. Privacy, Security, and Ethical Risks
Context graphs surface relationships that were previously fragmented. When combined, these relationships can reveal sensitive information such as:
Performance evaluations
Contract negotiations
Security incidents
Customer risk profiles
Personal productivity patterns
This creates heightened privacy and ethical concerns. Risks include:
Unauthorized inference
Data leakage
Biased recommendations
Over-surveillance
Enterprises must implement:
Fine-grained access controls
Purpose limitation policies
Differential privacy techniques
Bias monitoring
Human oversight
Without these protections, context graphs can become compliance liabilities rather than assets.
4. Scaling and Performance Complexity
Context graphs grow rapidly. As decisions accumulate, enterprises may reach:
Billions of nodes
Trillions of relationships
High-frequency updates
Complex query patterns
Naive graph implementations struggle at this scale. Common challenges include:
Query latency
Storage costs
Consistency management
Distributed synchronization
Failure recovery
To operate at scale, organizations need:
Partitioned graph architectures
Hybrid graph-vector systems
Caching layers
Streaming updates
Query optimization engines
Scaling context graphs is an infrastructure problem comparable to building large data platforms or cloud control planes.
5. Change Management and Trust Adoption
Even the best context graph fails if people do not trust it. Common adoption barriers include:
Fear of automation replacing judgment
Skepticism about model accuracy
Resistance to transparency
Comfort with manual processes
Many teams prefer familiar spreadsheets and ad-hoc analysis, even when they are inefficient. Building trust requires deliberate effort:
Start with decision support, not automation
Provide clear explanations
Allow human overrides
Publish success stories
Measure impact transparently
Organizations that rush into full autonomy without building confidence often face backlash.
The Race for Context Has Already Begun
By 2026, context capture is no longer a differentiator. It is becoming the default infrastructure.
Every serious SaaS platform is embedding mechanisms to record not just actions, but the reasoning behind them. Early adopters are already automating judgment-heavy decisions, discount approvals, infrastructure rightsizing, and vendor selection, while others are still debating them over email threads.
In FinOps, this shift is especially visible.
Teams equipped with context graphs are reaching advanced maturity levels almost overnight. Instead of reacting to spend, they operate with institutional memory. Every optimization, exception, and trade-off compounds into long-term intelligence.
Tomorrow’s cloud platforms will not be defined by how well they track costs.
They will be defined by how well they remember why those costs existed and how effectively they surface patterns no human team could ever detect.
A Final Question
If your organization had perfect memory, where would it create the biggest breakthrough?
Which judgment-heavy process – pricing, infrastructure planning, vendor selection, compliance reviews, capacity forecasting – would unlock 10x value if every past decision were instantly reusable?
That answer is your starting point.
And in 2026, it may determine whether you lead the next wave of enterprise intelligence or struggle to catch up.
[Request a demo and speak to our team]
[Sign up for a no-cost 30-day trial]
[Check out our free resources on FinOps]
[Try Amnic AI Agents today]
Recommended Articles
8 FinOps Tools for Cloud Cost Budgeting and Forecasting in 2026
5 FinOps Tools for Cost Allocation and Unit Economics [2026 Updated]
Read Our Breaking Bill Edition
Better visibility and management into AI Tokens?
Start with a 30 day trial
Connect leading LLMs
24 hour time to value
Stay ahead of AI Spend

Make AI spend visible, controllable, and accountable.
Gain insights into your AI token costs at a team, customer, business unit and individual user level to measure and manage AI utilization.
Recommended Articles

What Is a Network Gateway? Types, Functions and Real-World Use Cases
Read More

What Is Platform as a Service (PaaS) in Cloud Computing?
Read More

The Bill Nobody Could Explain: Inside Amazon Athena’s Hidden Cost Spikes
Read More

What Is Vendor Lock-In and How Can You Avoid It?
Read More

Why FinOps and GreenOps Are Better Together in 2026
Read More

Multi-Cloud Inventory Management: How to Track Assets Across AWS, Azure, and GCP
Read More


