Everything that went live in October
Improved dashboards, virtual tagging, hierarchy management, and better cost visibility.

We’ve rolled out a set of powerful updates in October to help you organize cloud data better, visualize insights faster, and manage anomalies with more context.
Here’s what’s new in Amnic:
Dashboard Enhancements
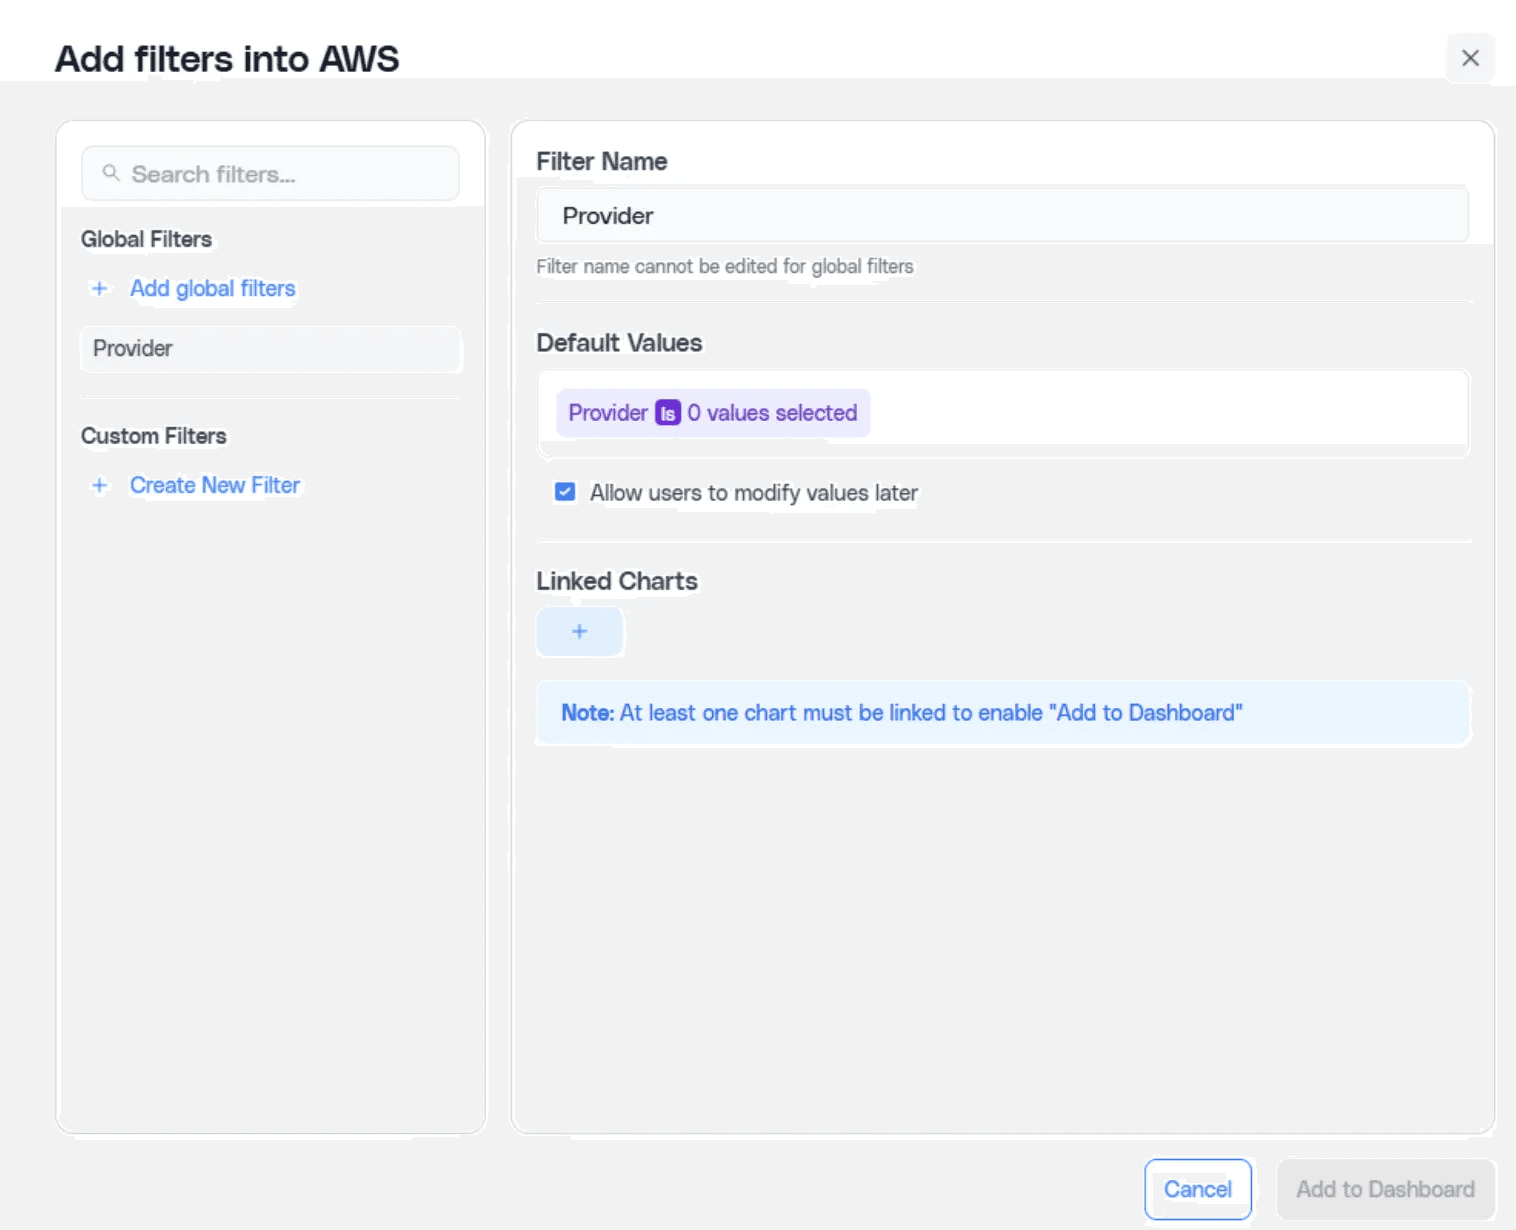
Dashboard-level filters
You can now apply filters across multiple charts in one go.
Create Global Filters for dimensions like Provider or Region.
Build Custom Filters that merge similar fields across providers into a single control.
Set default values, lock filters for specific views, and share dashboards confidently, knowing that viewers only see data they have access to.
Dashboard cloning
You can duplicate any existing dashboard, complete with charts, widgets, filters, and layout, with just one click. It’s perfect for setting up team-specific or customer-specific dashboards without rebuilding from scratch. The cloned dashboard automatically assigns you as the owner.
Chart and Visualization Improvements
Comparative view in line charts
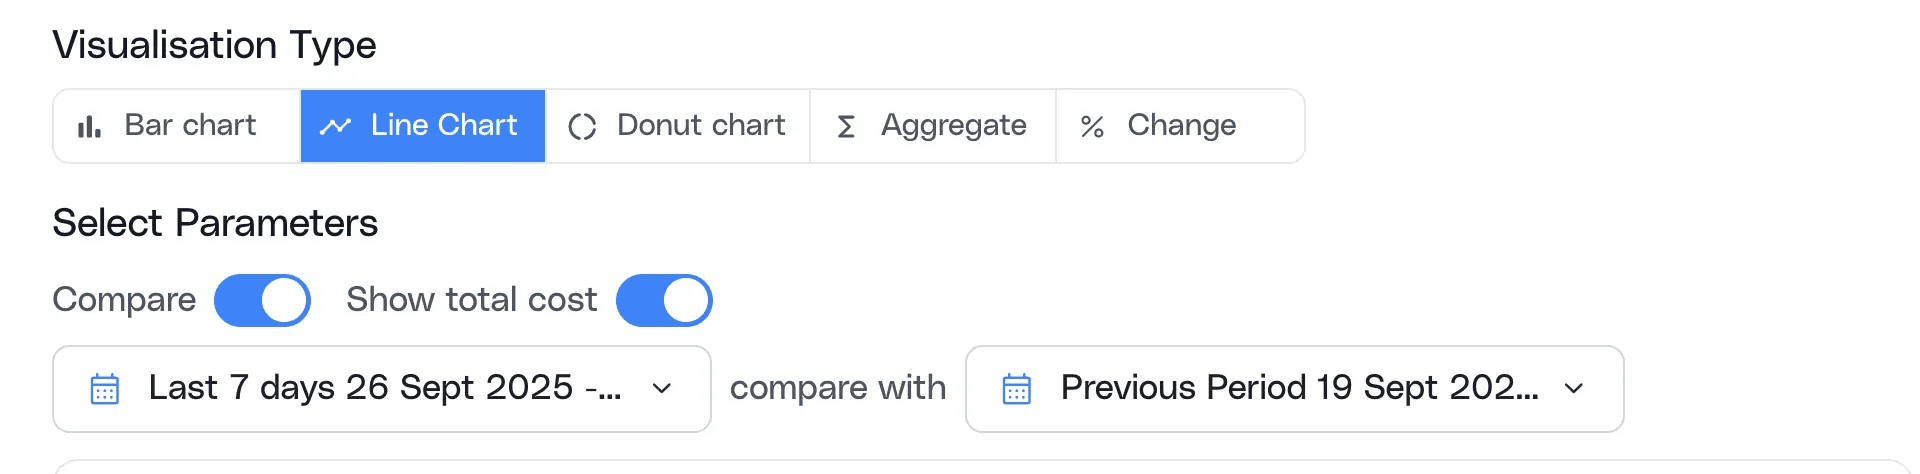
You can now compare current and previous periods directly within your line charts. Toggle comparison mode, pick your time frames, and visualize both trends side by side for quick insights.
New “Sum” comparison method
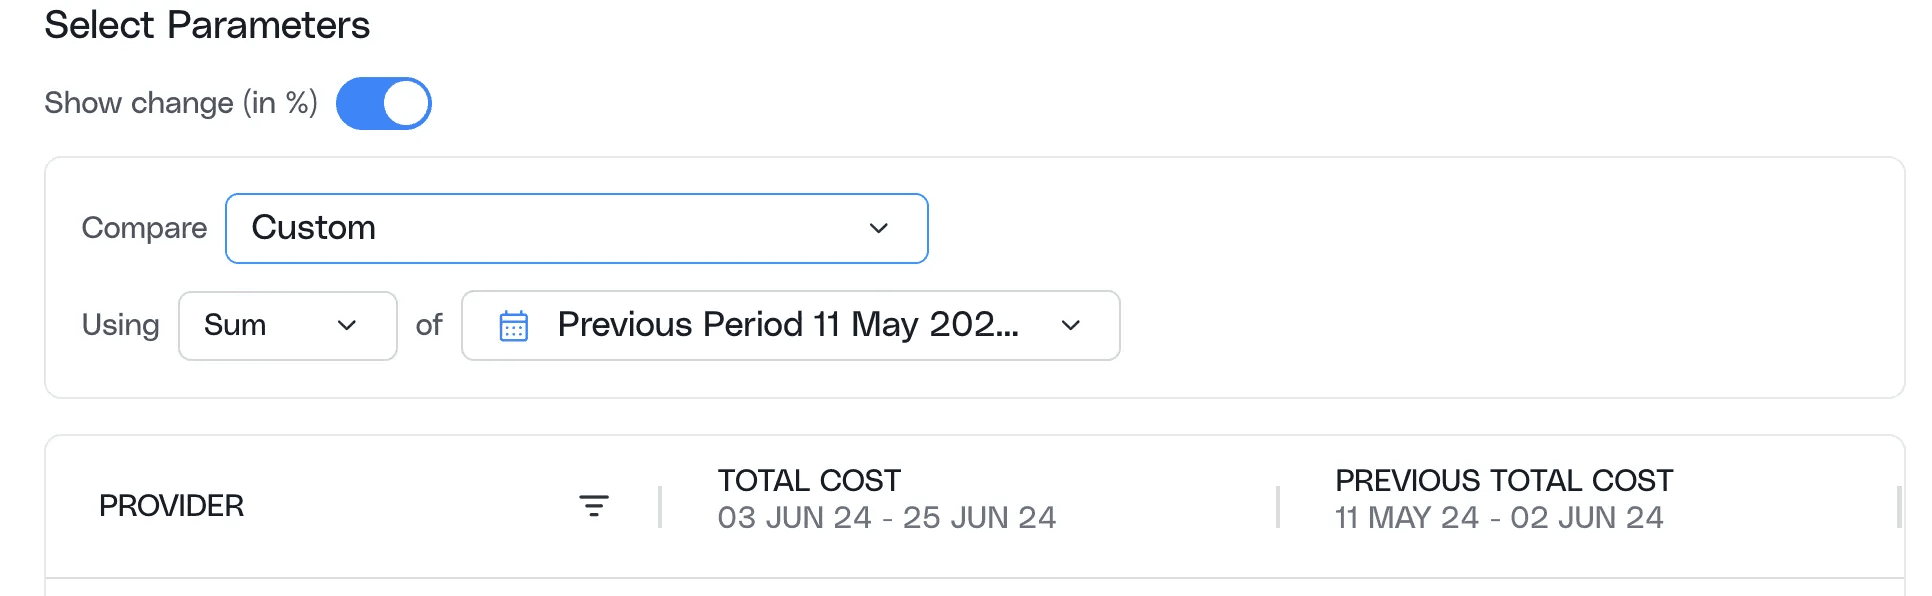
When analyzing data in tables, you can compare periods using Sum aggregation to get a consolidated view of total values, helping you understand changes at a glance.
Aggregate-only table switcher
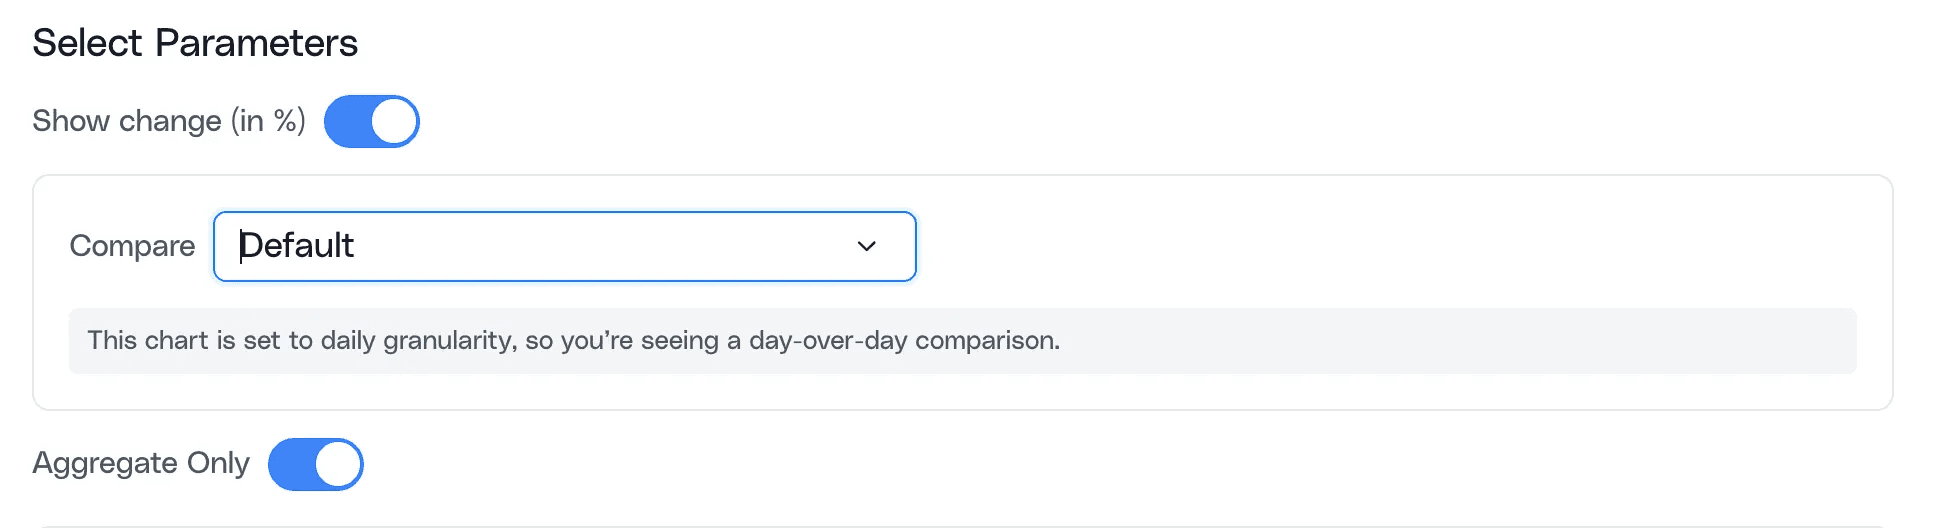
You can switch to a high-level view that displays only aggregate values, letting you focus on overall totals without detailed breakdowns.
Improved tooltip handling
Long resource names are now fully visible in tooltips. Pie chart slice totals display correctly, and line chart details appear only on hover for a cleaner look.
Unified legend sizing
Legends now maintain consistent sizing across all visualizations, giving your dashboards a more polished and uniform appearance.
Enhanced Anomaly Alerts
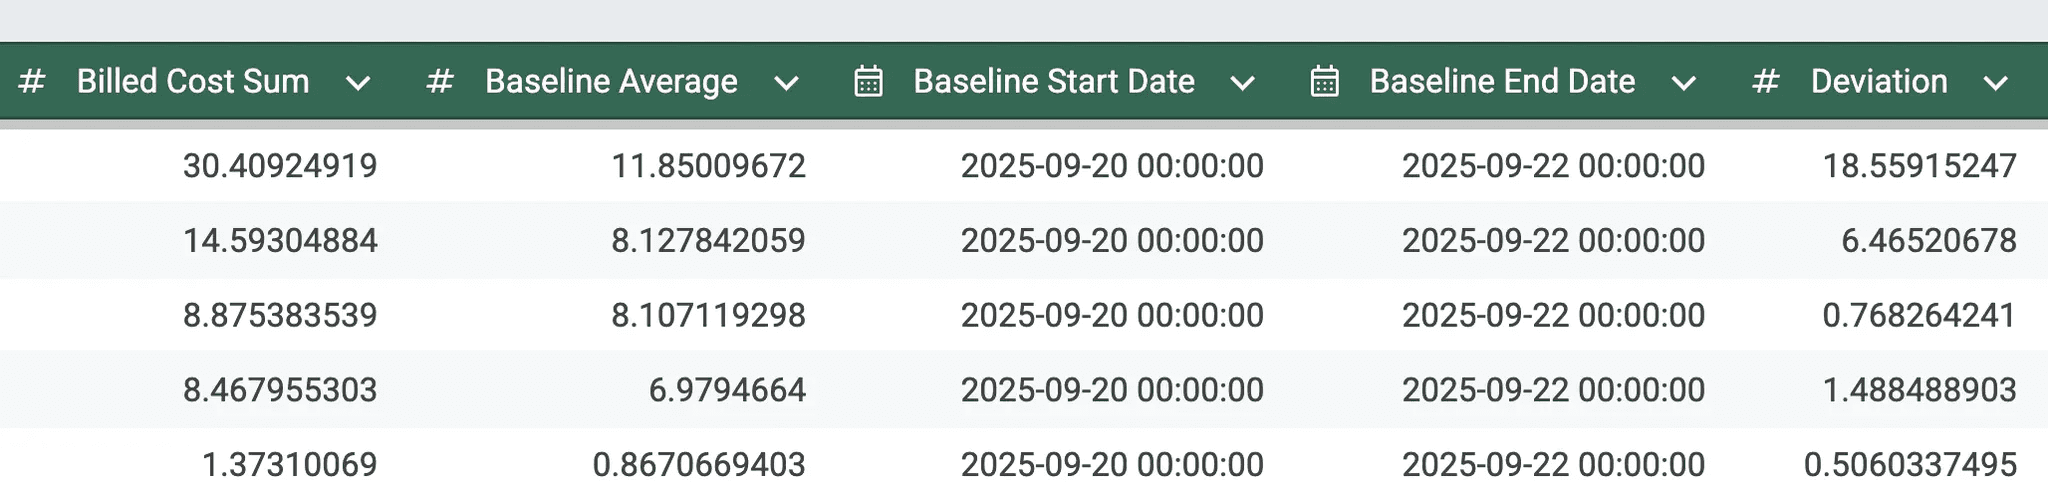
You can now export anomaly alerts from Slack with detailed comparison data and baseline calculations used for detection. This gives you deeper visibility into why an anomaly was triggered, without needing to leave your workflow.
Virtual Tags
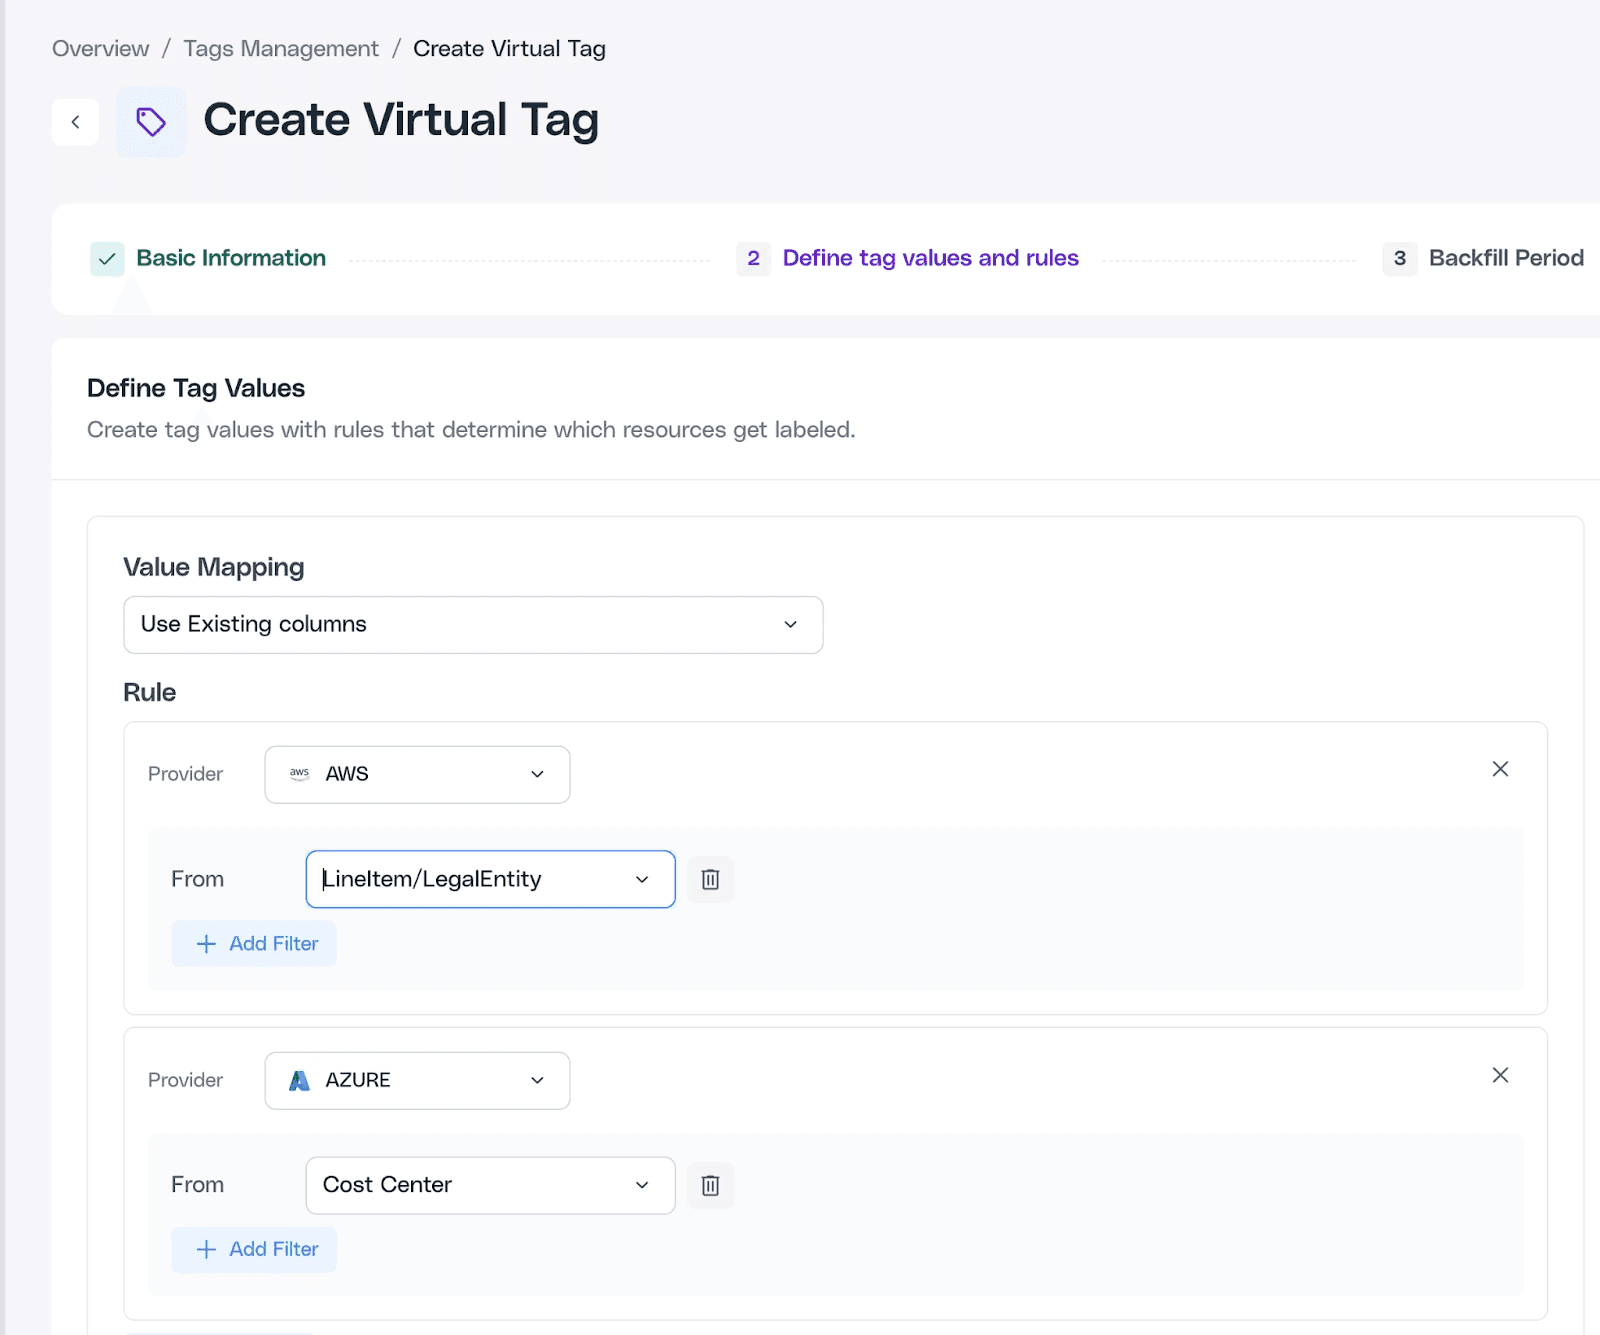
Virtual Tags let you standardize and categorize cloud costs, without changing your underlying infrastructure.
You can create rule-based mappings that automatically organize resources into the right teams, projects, or business units. No more dealing with inconsistent native tags like “prod,” “PROD,” or “production.”
Virtual Tags work across AWS, Azure, GCP, and major SaaS platforms, helping you build a unified taxonomy that fits your business. Use them for cost allocation, compliance tracking, or environment normalization.
Note: Only admins can create Virtual Tags at this time.
Virtual Hierarchy
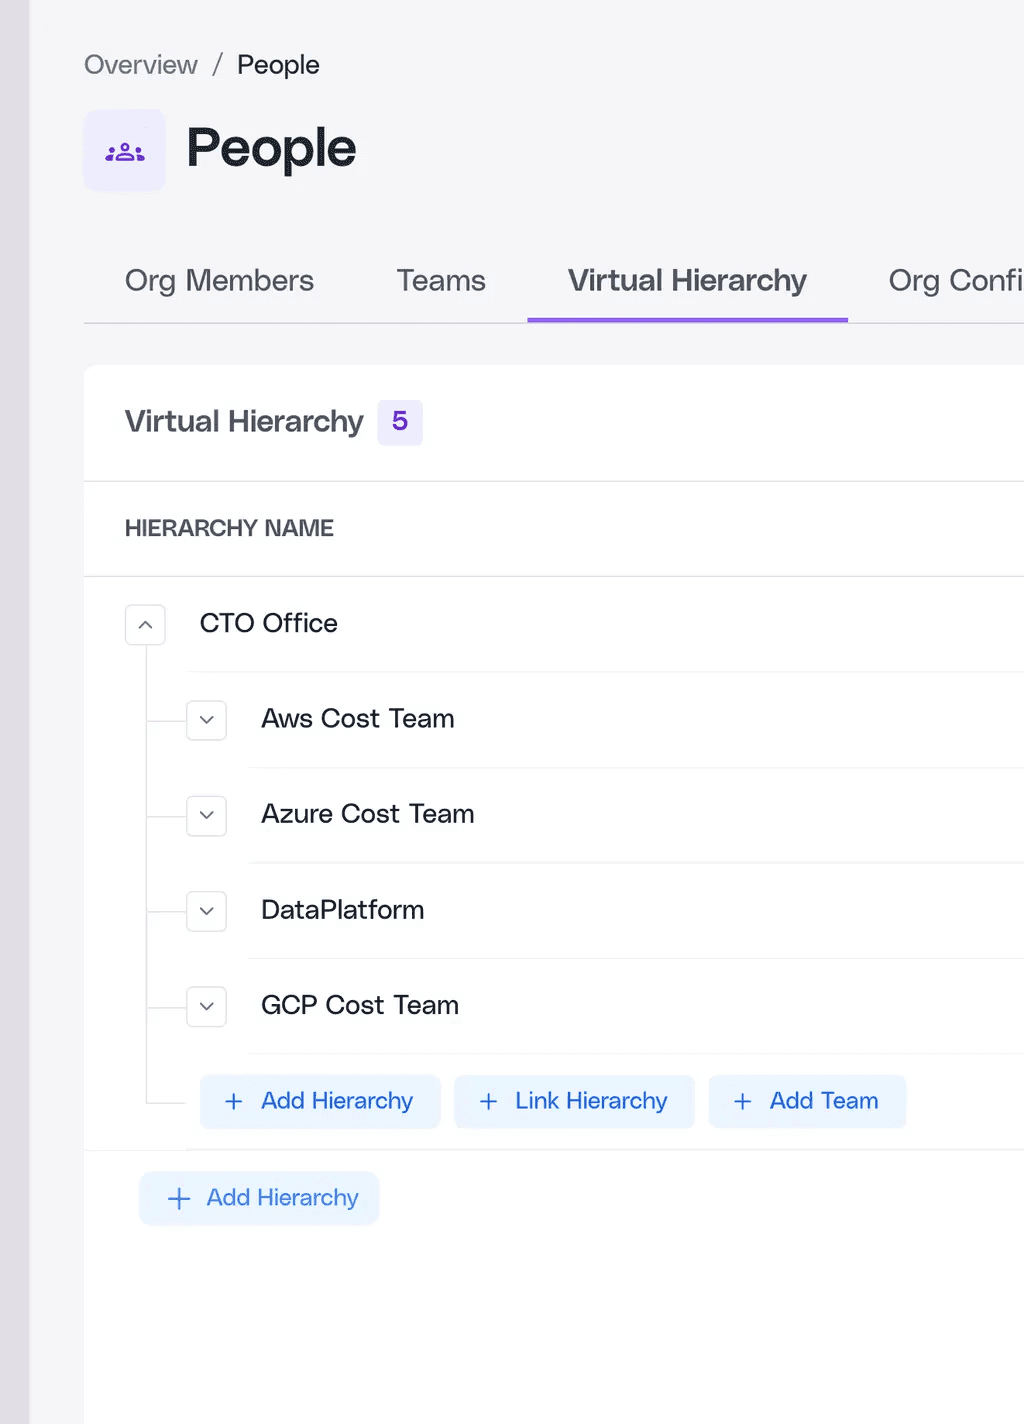
With Virtual Hierarchy, you can structure your cloud cost data to mirror how your organization operates. It brings together visibility for leadership and autonomy for individual teams.
You can:
Create hierarchies with up to five nested levels
Assign roles and permissions that inherit automatically across levels
Link hierarchies across departments for shared, read-only access
Switch between organization-level and team-level views effortlessly
Access hierarchy-level dashboards and anomaly insights in one place
Note: Currently, only organization admins can create and manage hierarchies to maintain governance during rollout.
That wraps up October! These updates are designed to make managing, visualizing, and structuring your cloud costs even easier. We’re already working on the next round of improvements, stay tuned for more updates coming soon.


