Usage, Counts, Defaults: Here’s what’s new in Cost Analyzer
Cost Analyzer now tells you the full story.

You asked for more than just cost numbers. This release delivers exactly that. Usage data, resource counts, smarter defaults, and a bunch of quality-of-life improvements that make Cost Analyzer feel like it was built just for your workflow. Let's get into it.
1. See how much of each resource you're actually using
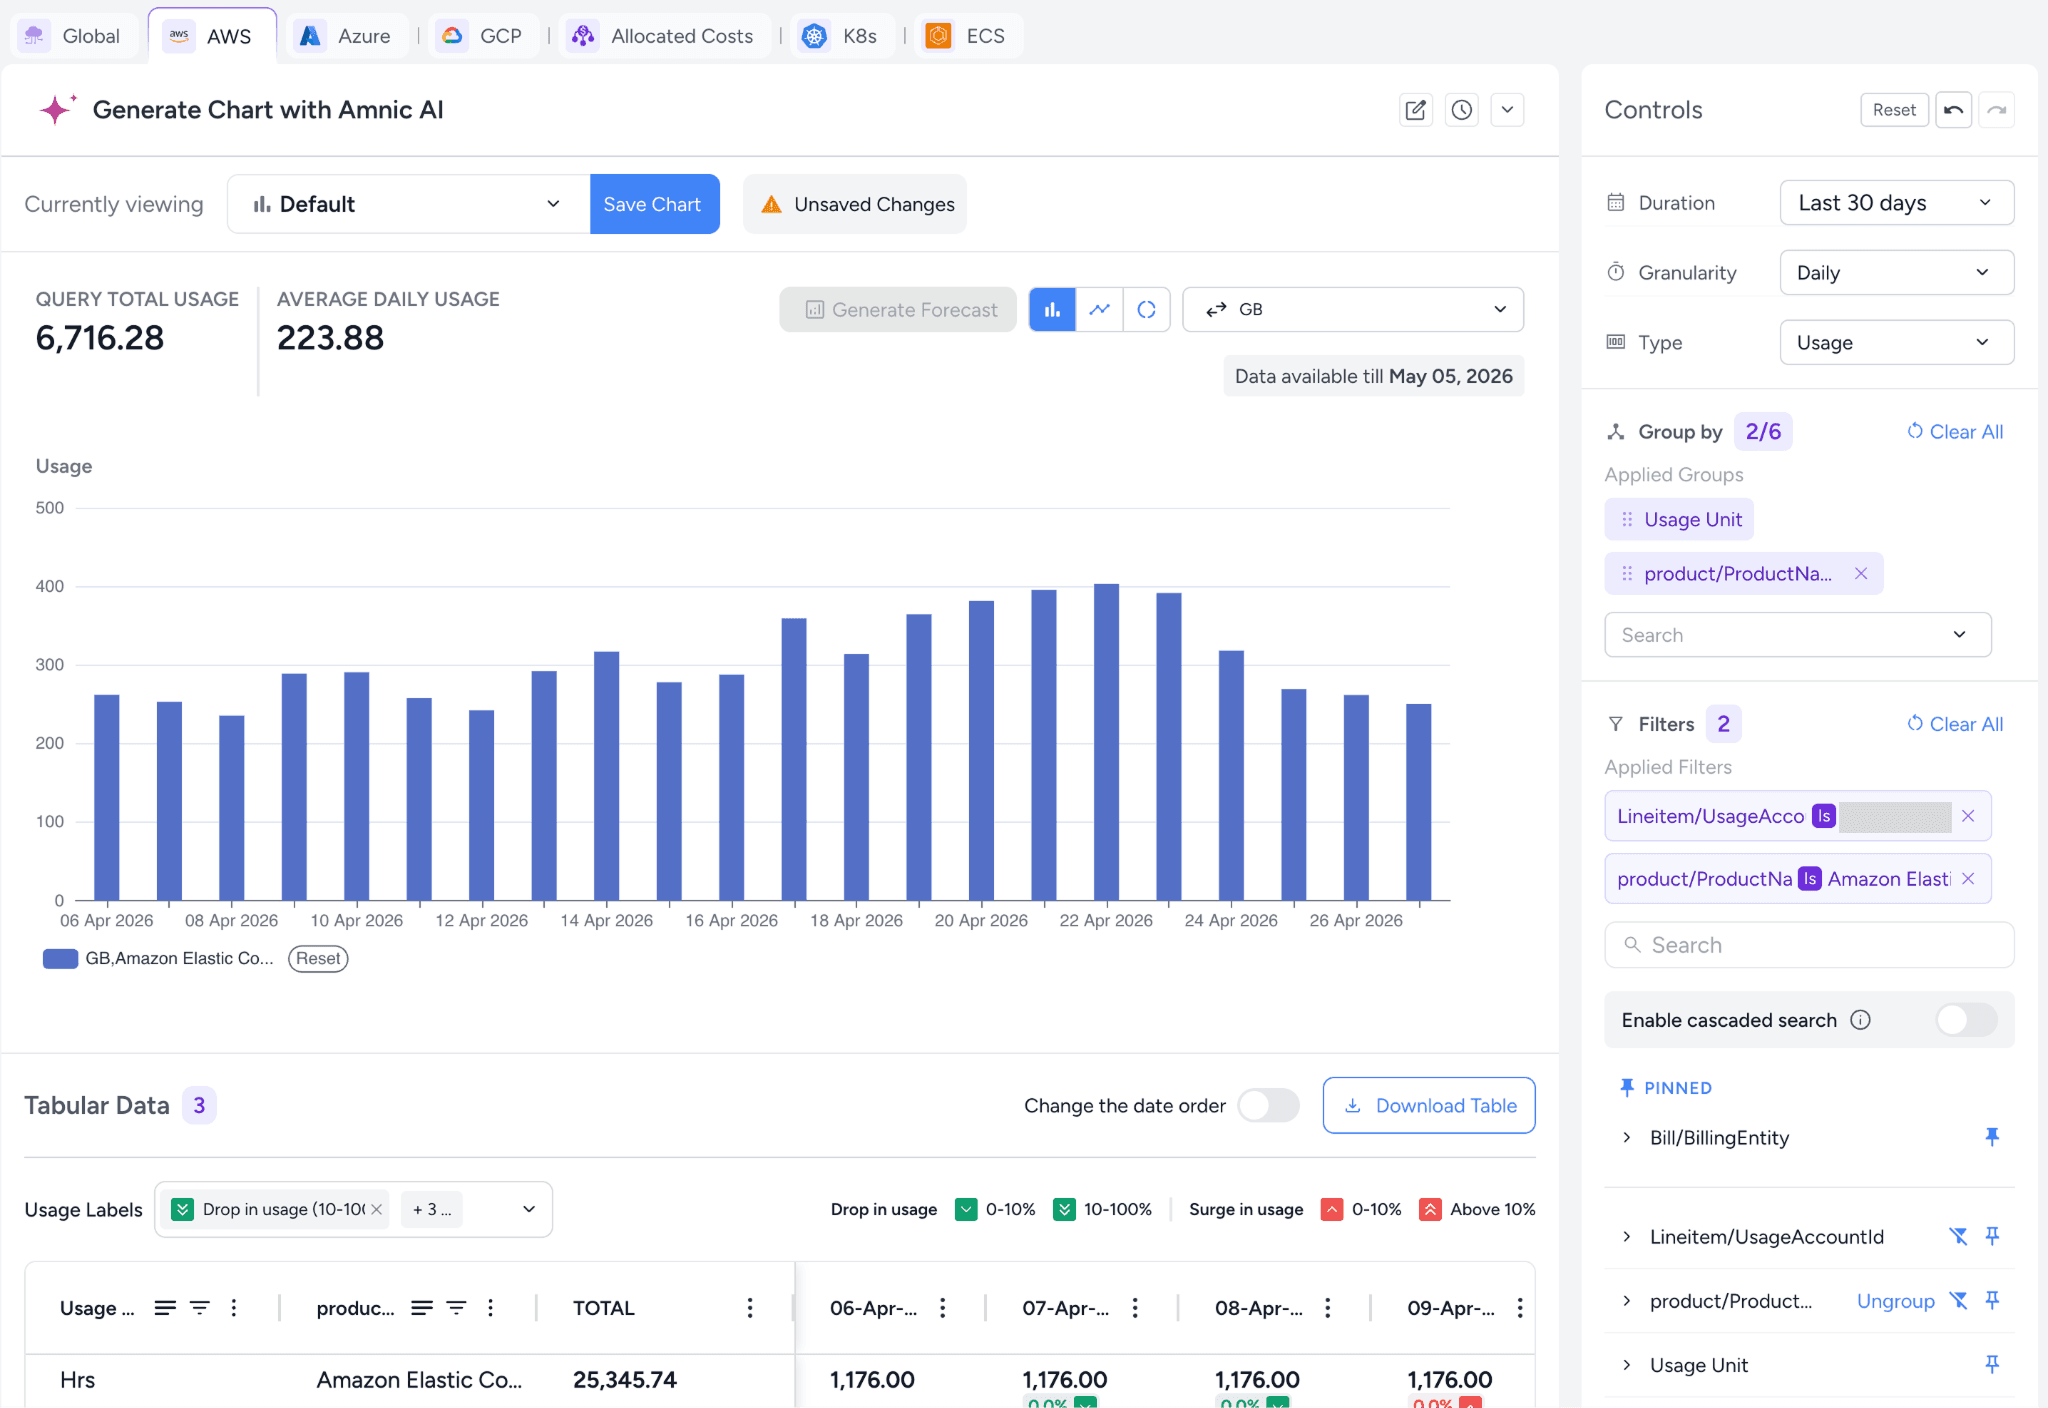
Cost Analyzer now shows usage alongside cost. See how many hours your EC2 servers ran, how much S3 storage you consumed, and more. Answer the questions that actually matter, like why your bill went up and whether it was worth it.
Tip: Since every service measures usage differently (EC2 uses hours, S3 uses GB, Lambda uses GB-seconds), filter to a specific service first for the clearest view.
2. Know how many resources were running on any given day
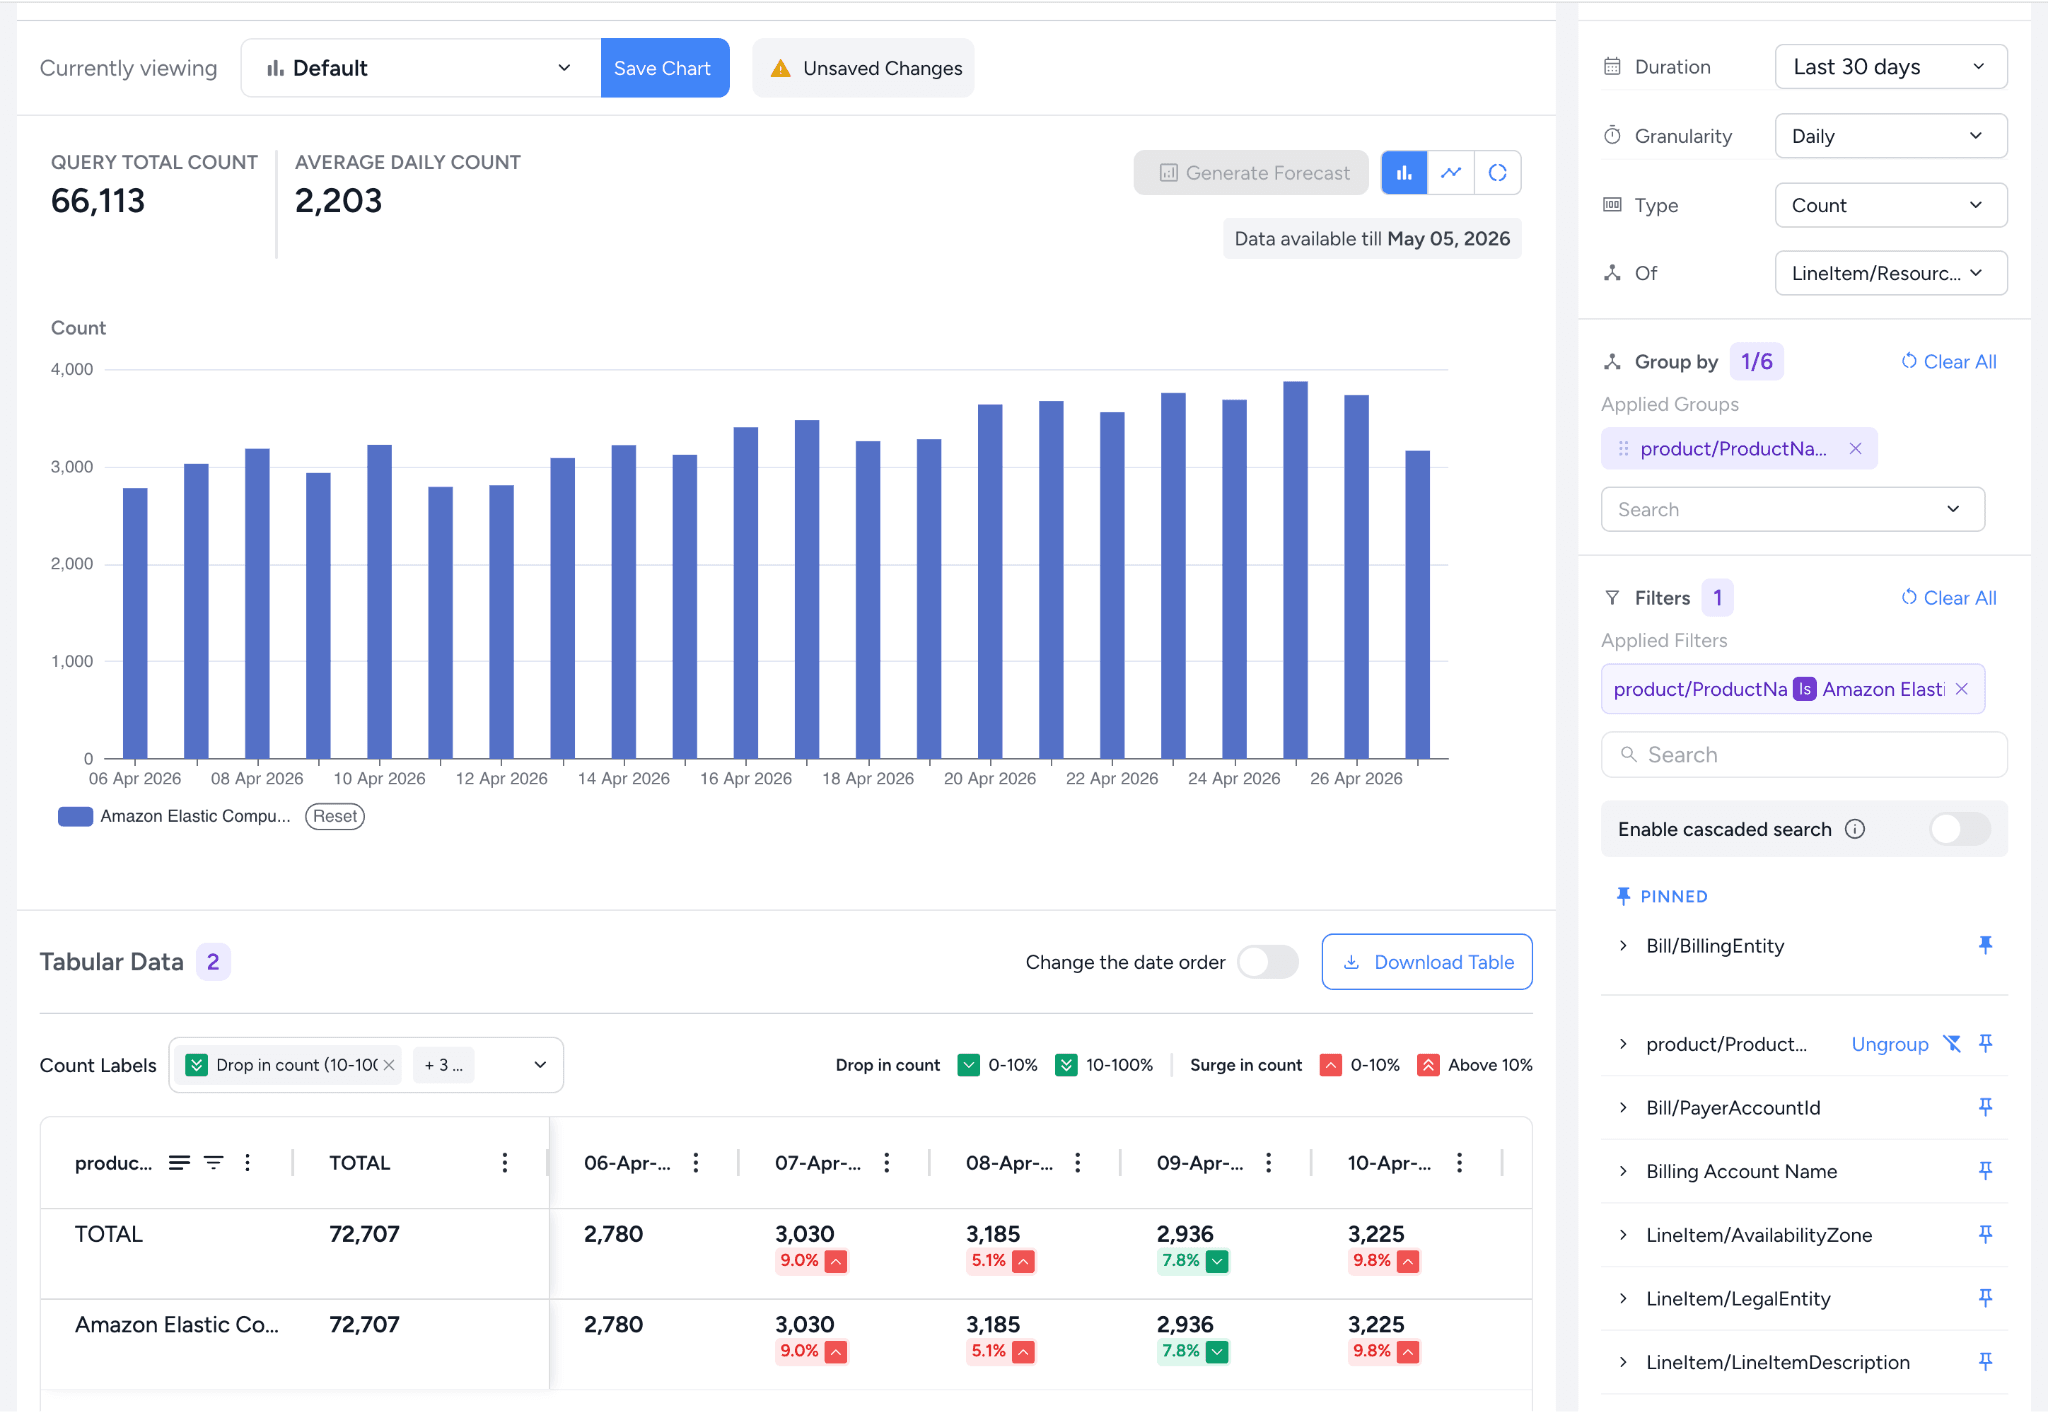
You can now see the count of billable resources per day, not just what they cost. When your EC2 bill jumps, but resource count stays flat, the culprit is likely higher usage per instance or a pricing change, not new servers spinning up. And if the count itself jumped, capacity grew.
Tip: Count works best when filtered to a specific service, the same as Usage
3. Save any of these charts to your dashboard
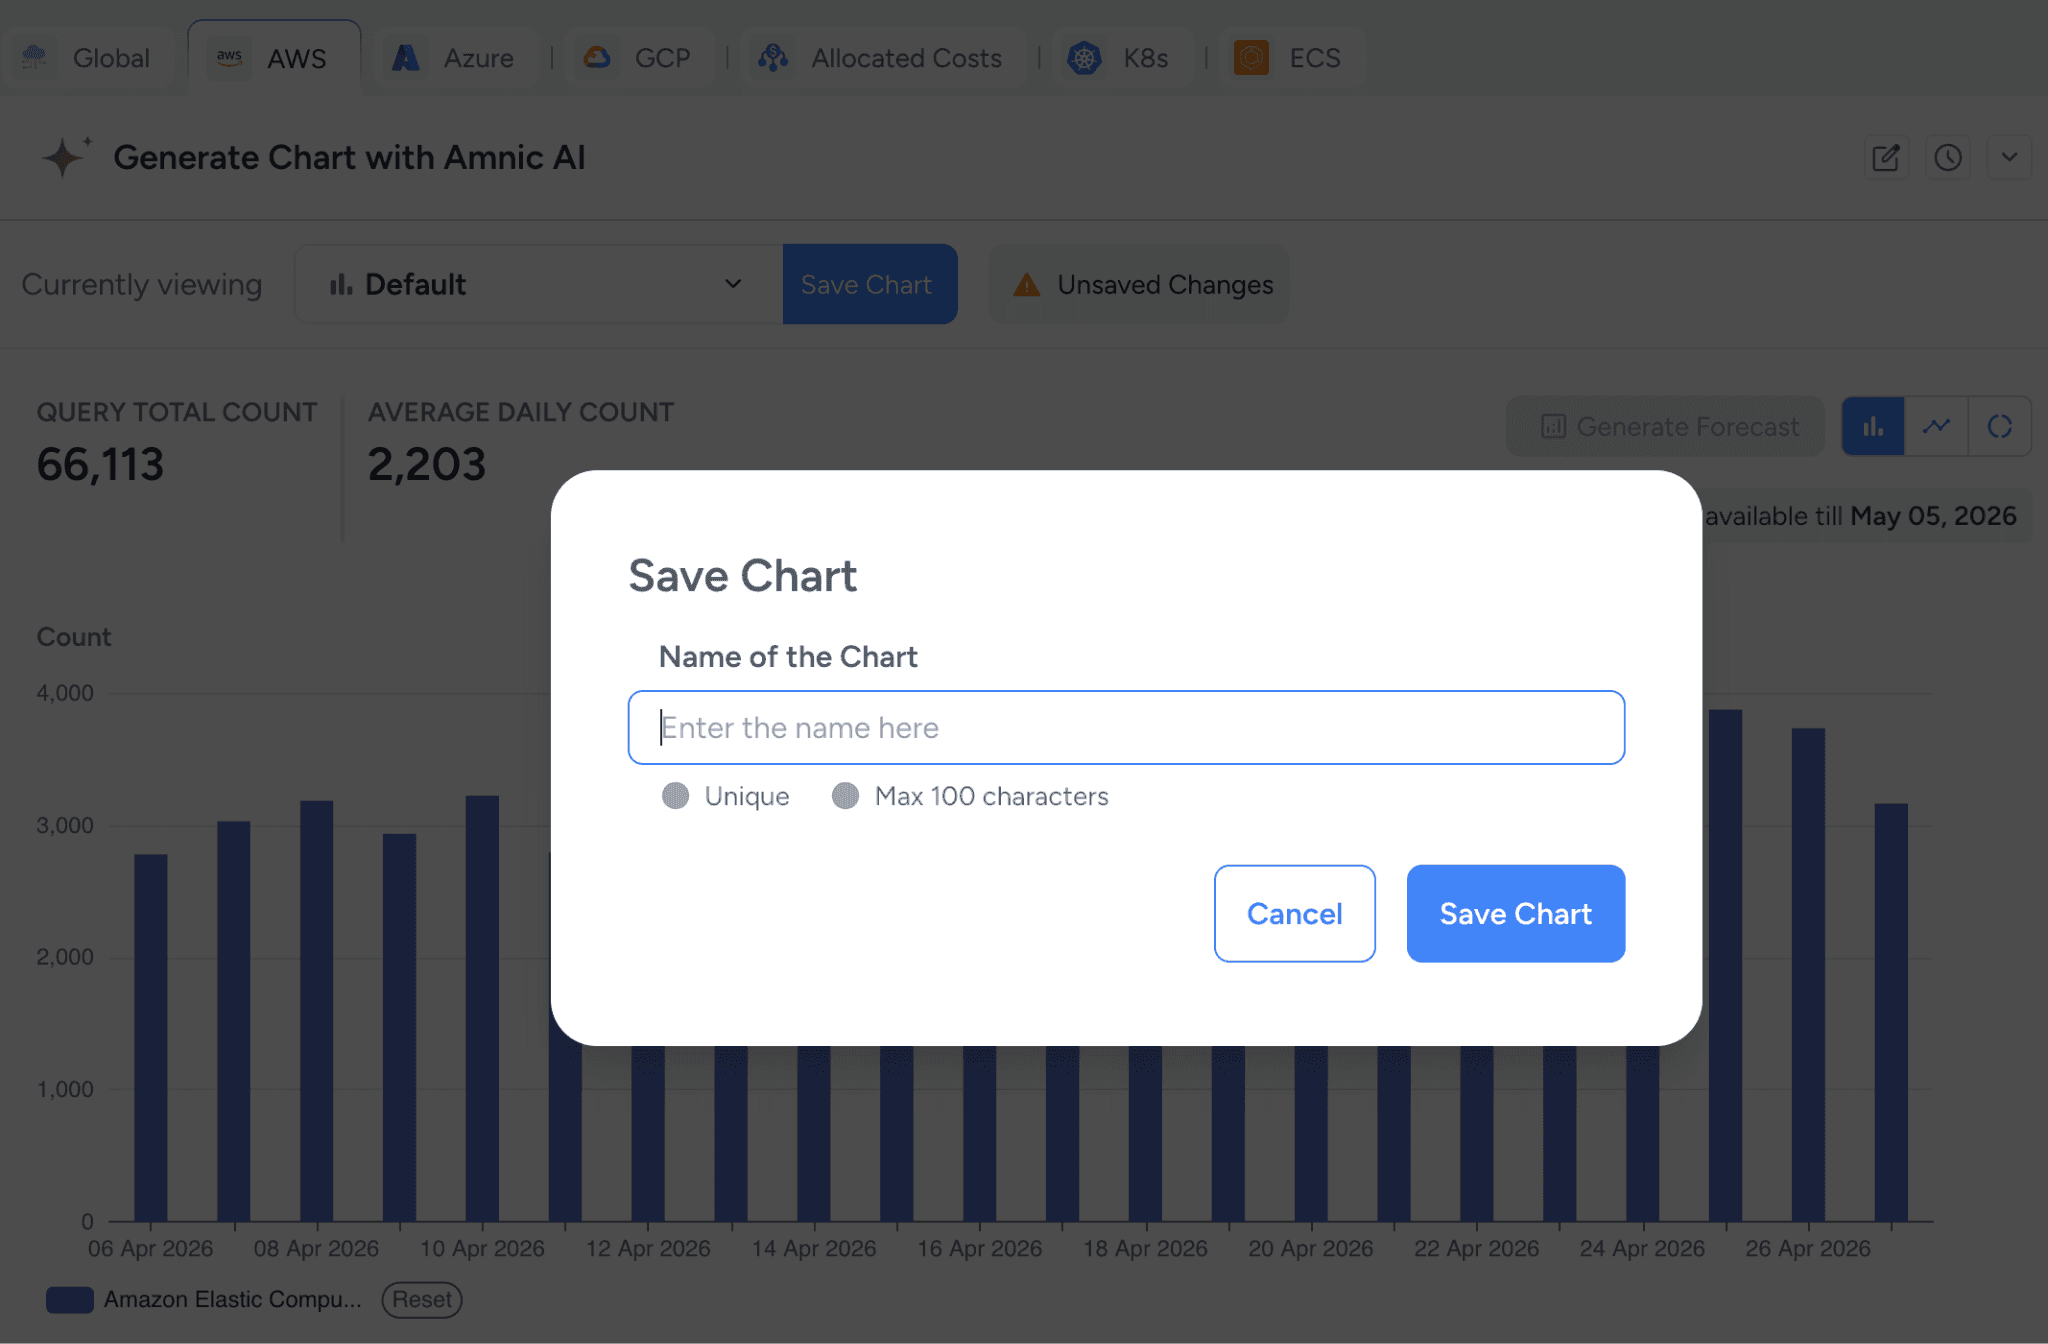
Built a Usage or Count chart you love? Save it to a Custom Dashboard so you and your team can monitor it over time without rebuilding it each visit.
4. Undo and redo changes in Cost Analyzer
Accidentally removed a filter or changed the wrong date range? You can now undo and redo any changes you make in the Controls panel. So the next time you accidentally remove a filter, change the date range, or make any other adjustment you didn't intend, just hit undo.
5. Wrap long text in table columns
Some columns in the Cost Analyzer table, like resource descriptions or tag values, contain long text that gets cut off. You can now wrap the text to read the full value without exporting.
6. Pin your most-used filters
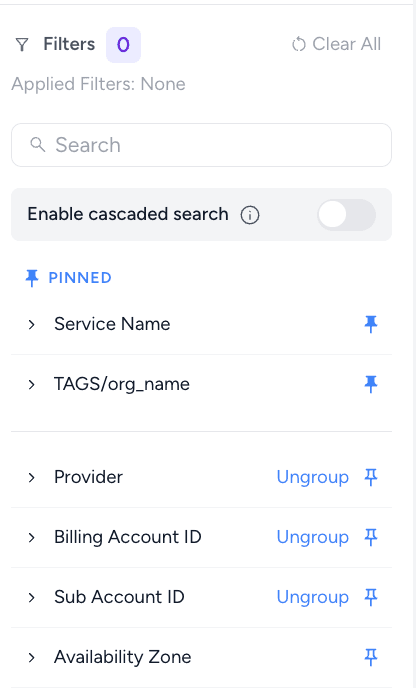
Say goodbye to hunting through the filter list every time. Pin the filters that matter most to your cost analysis directly in the Filters panel, so they're always right where you need them. Unpin the ones you don't need.
7. Give your team a head start in Cost Analyzer
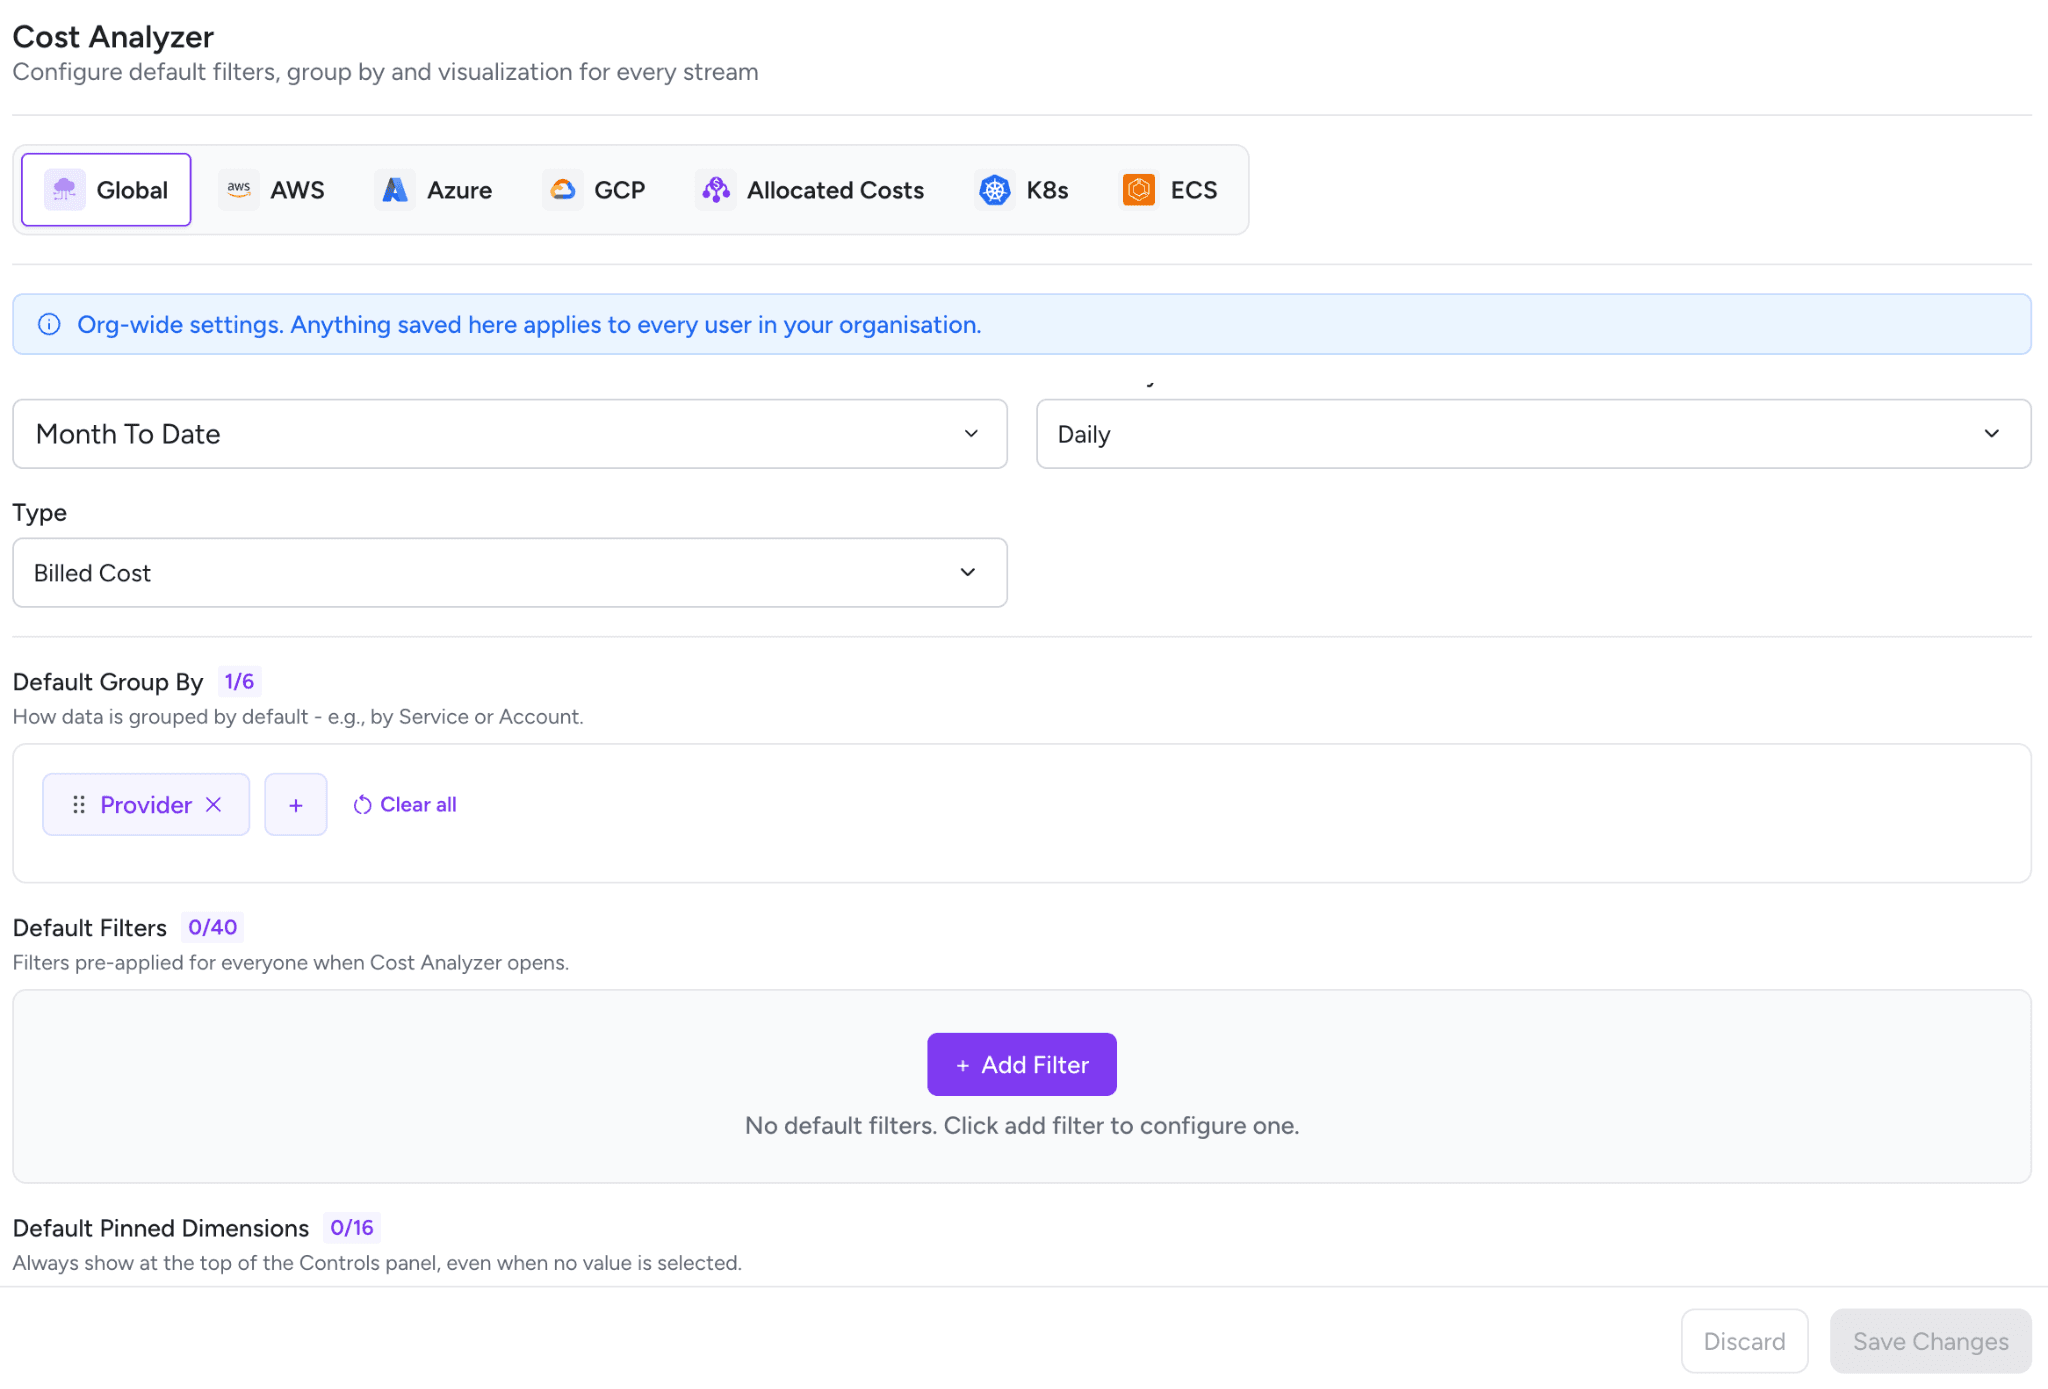
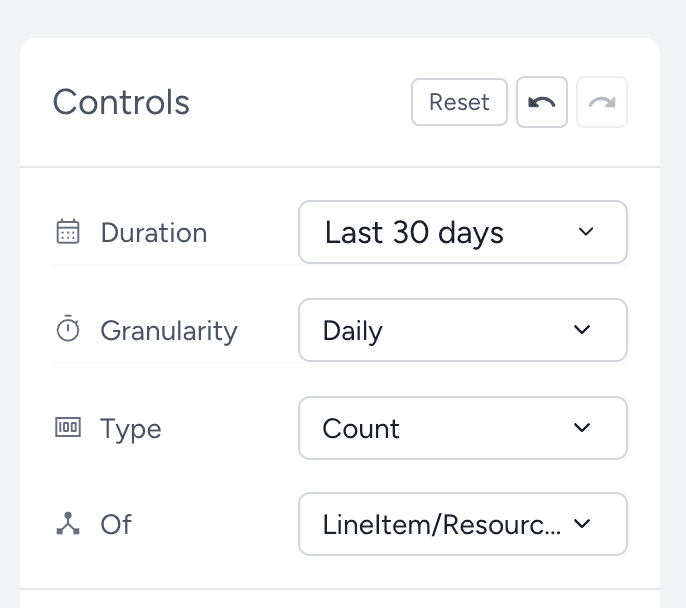
Admins can now configure default settings for Cost Analyzer that apply to every user in the organization. Set the default date range, granularity, cost type, group by, filters, and pinned dimensions globally or per cloud provider. Every change saved here rolls out org-wide instantly, so your team always opens Cost Analyzer to a view that's ready to go.
Ready to explore? Head over to Cost Analyzer and try it out.


