Track commitment performance and savings with Commitment Reports
Track utilization, coverage, and savings across all commitments

This one's been a long time coming. Commitment Reports are now live, giving you a complete picture of your Reserved Instances and Savings Plans in one place. This will help you get real-time visibility into how well your commitments are being utilized and how much you're actually saving.
What's new
Switch between Reserved Instances and Savings Plans views
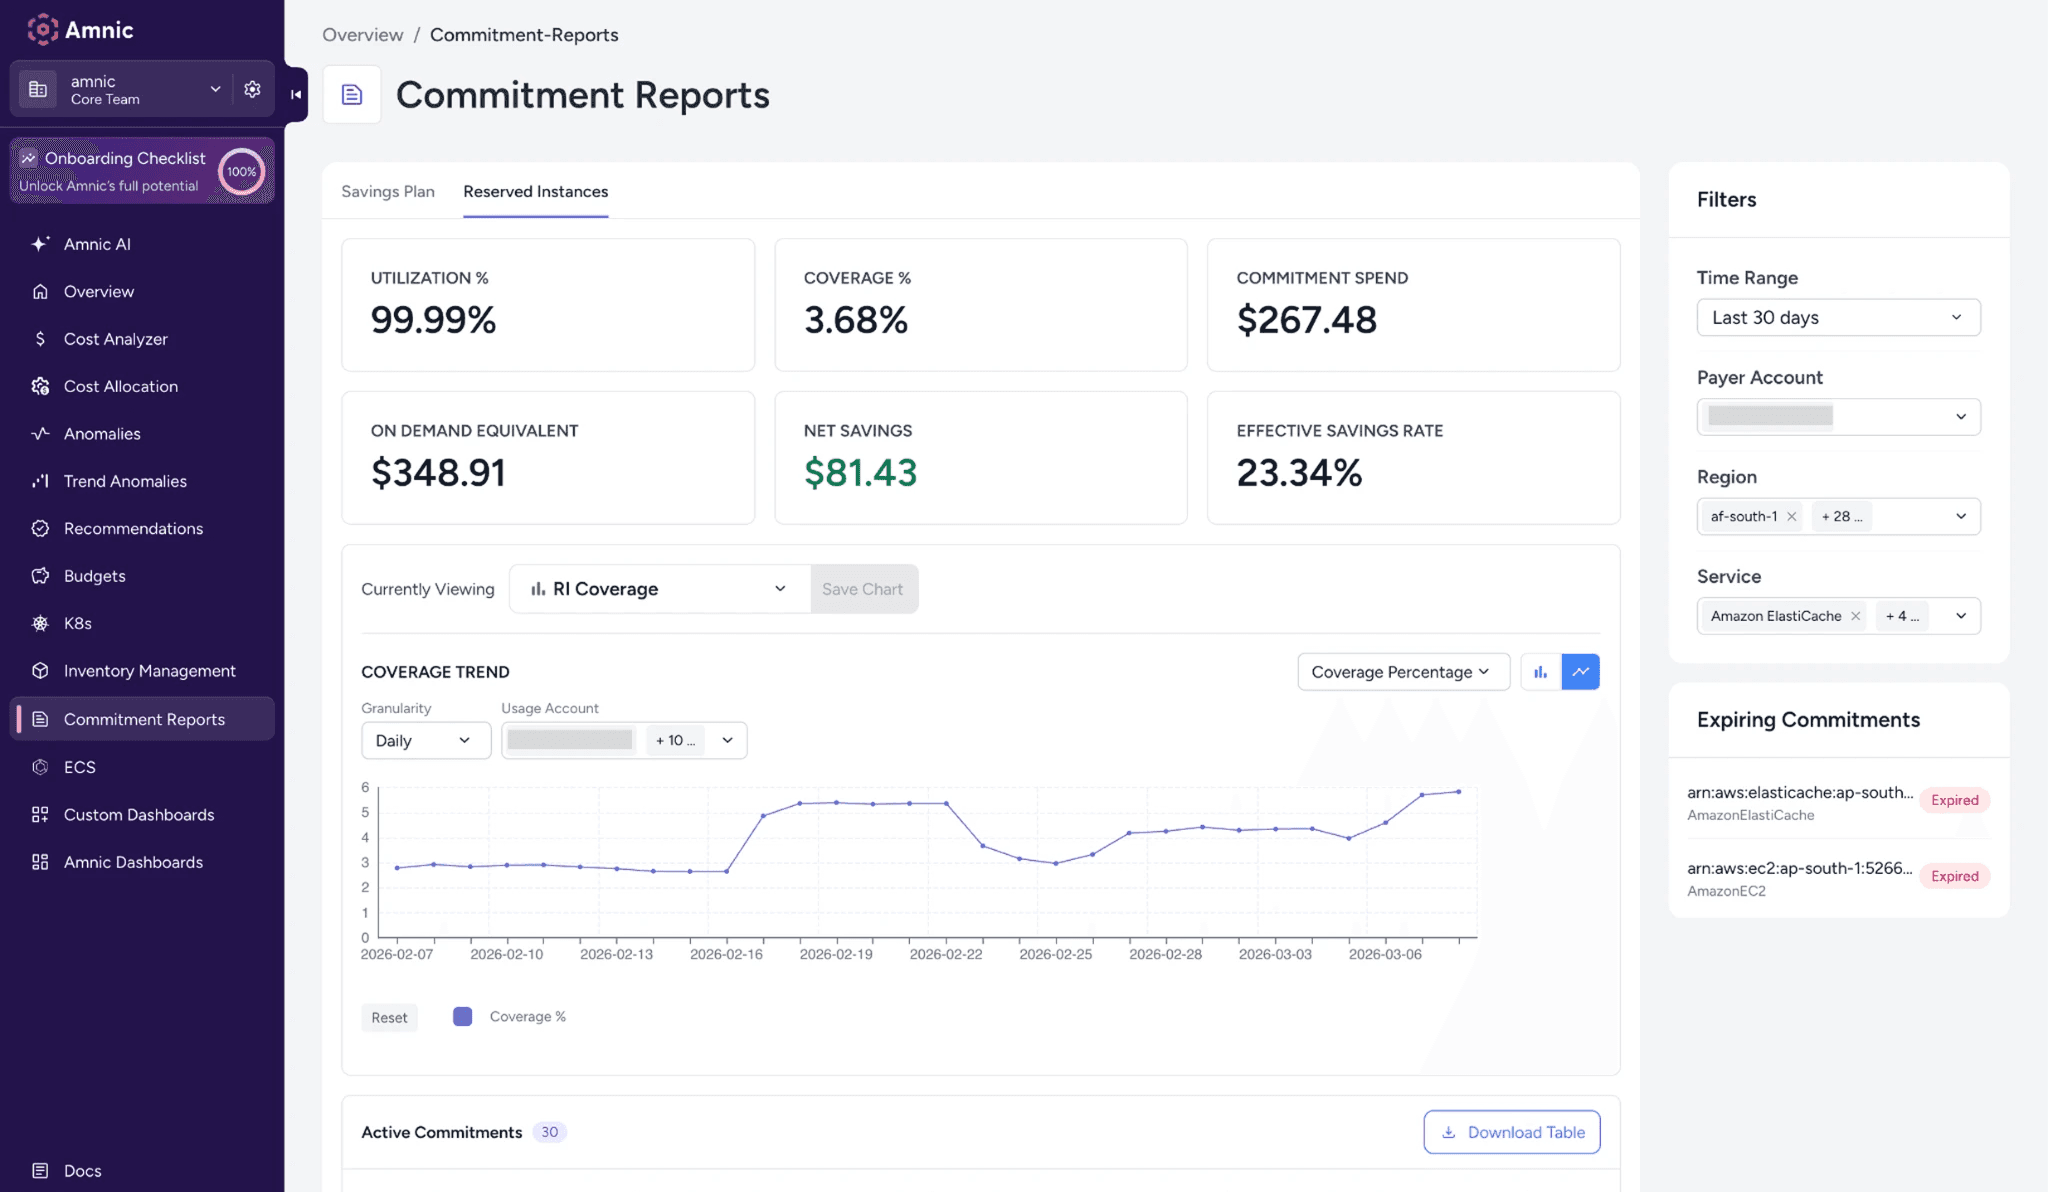
Toggle between RI and Savings Plan tabs to see utilization, coverage, net savings, commitment spend, and effective savings rate at a glance.
Trend charts that actually tell a story
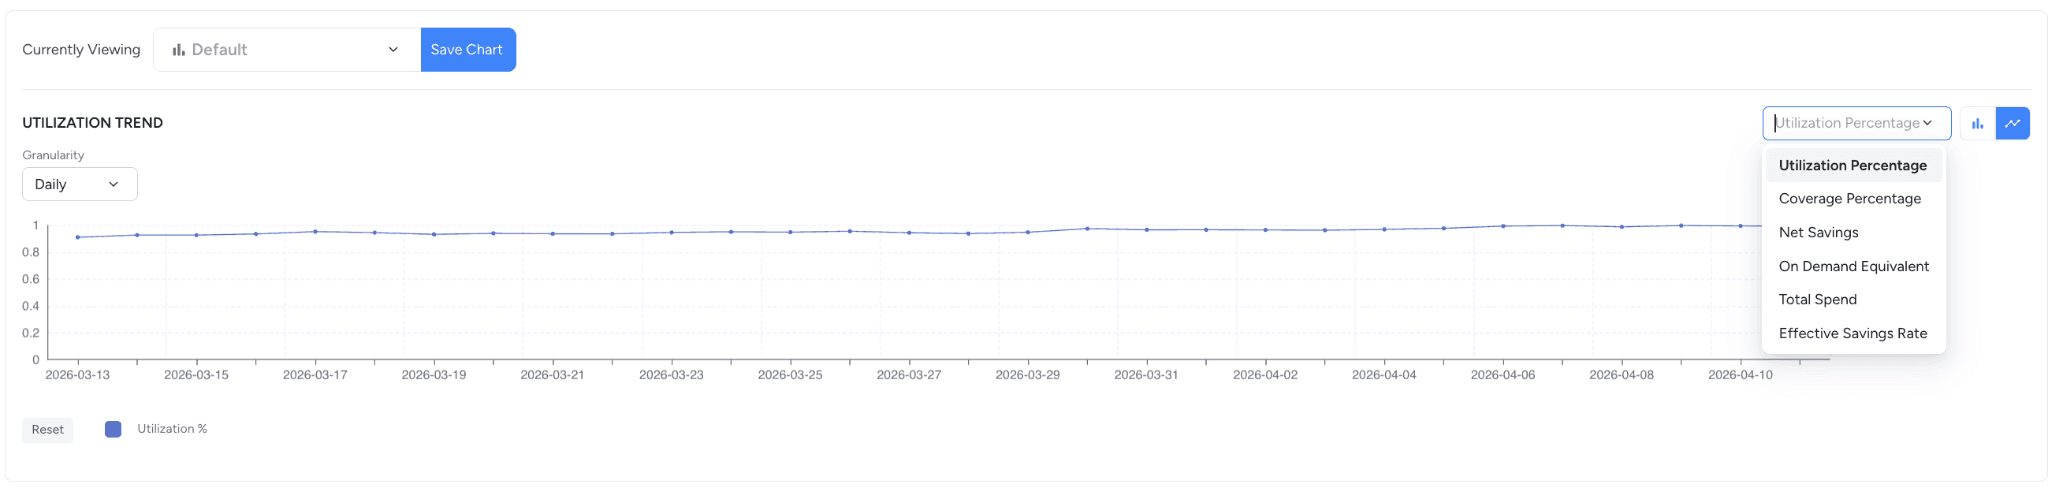
Visualize coverage and utilization trends over time with flexible granularity and filters by payer account, region, and service. Toggle between coverage percentage, net savings, on-demand equivalent, and more.
Stay ahead of expiring commitments
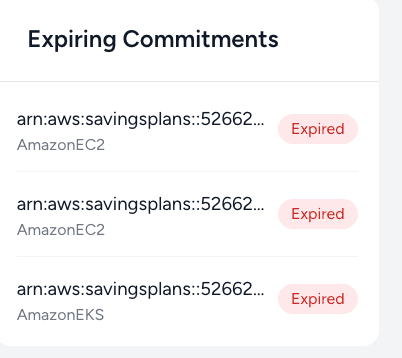
A dedicated panel flags commitments that are expired or about to expire, so you're never caught off guard.
View all your active Commitments
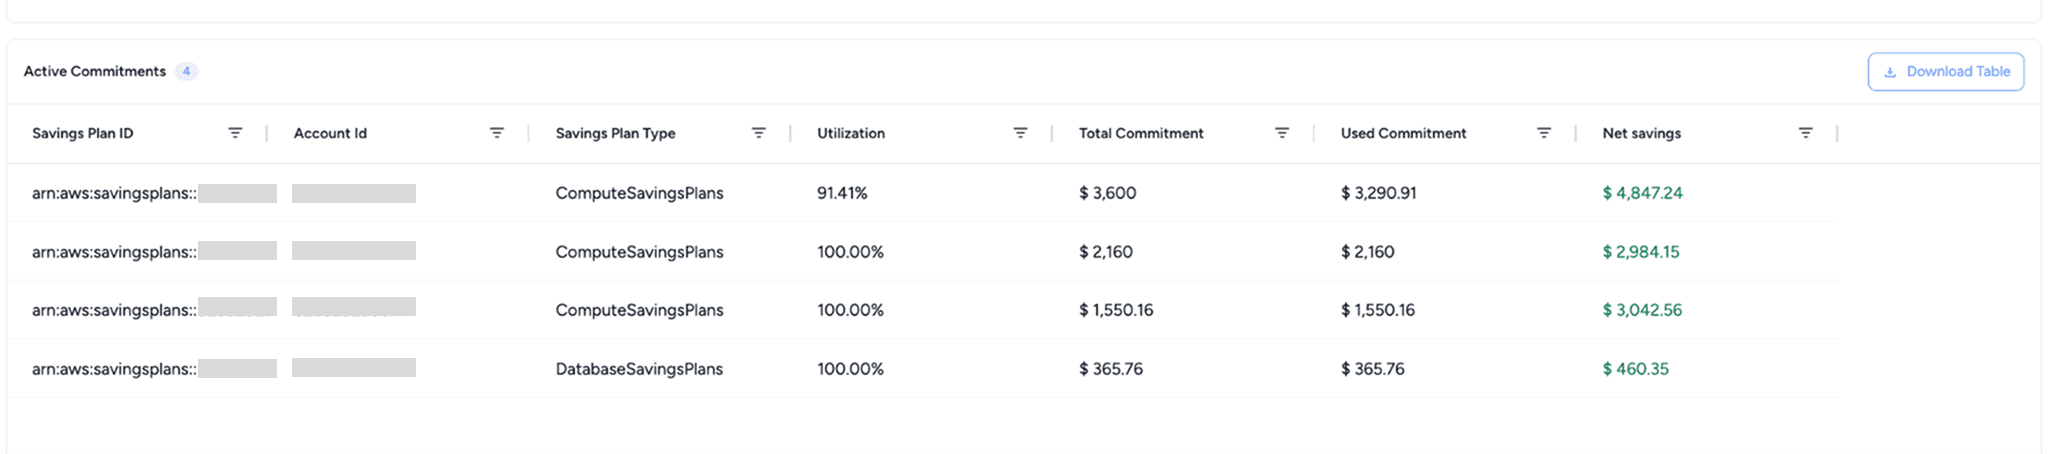
See all your active RIs and Savings Plans along with different metrics like utilization, total and used commitment and net savings, all downloadable with one click.
Pin commitment charts to Custom Dashboards
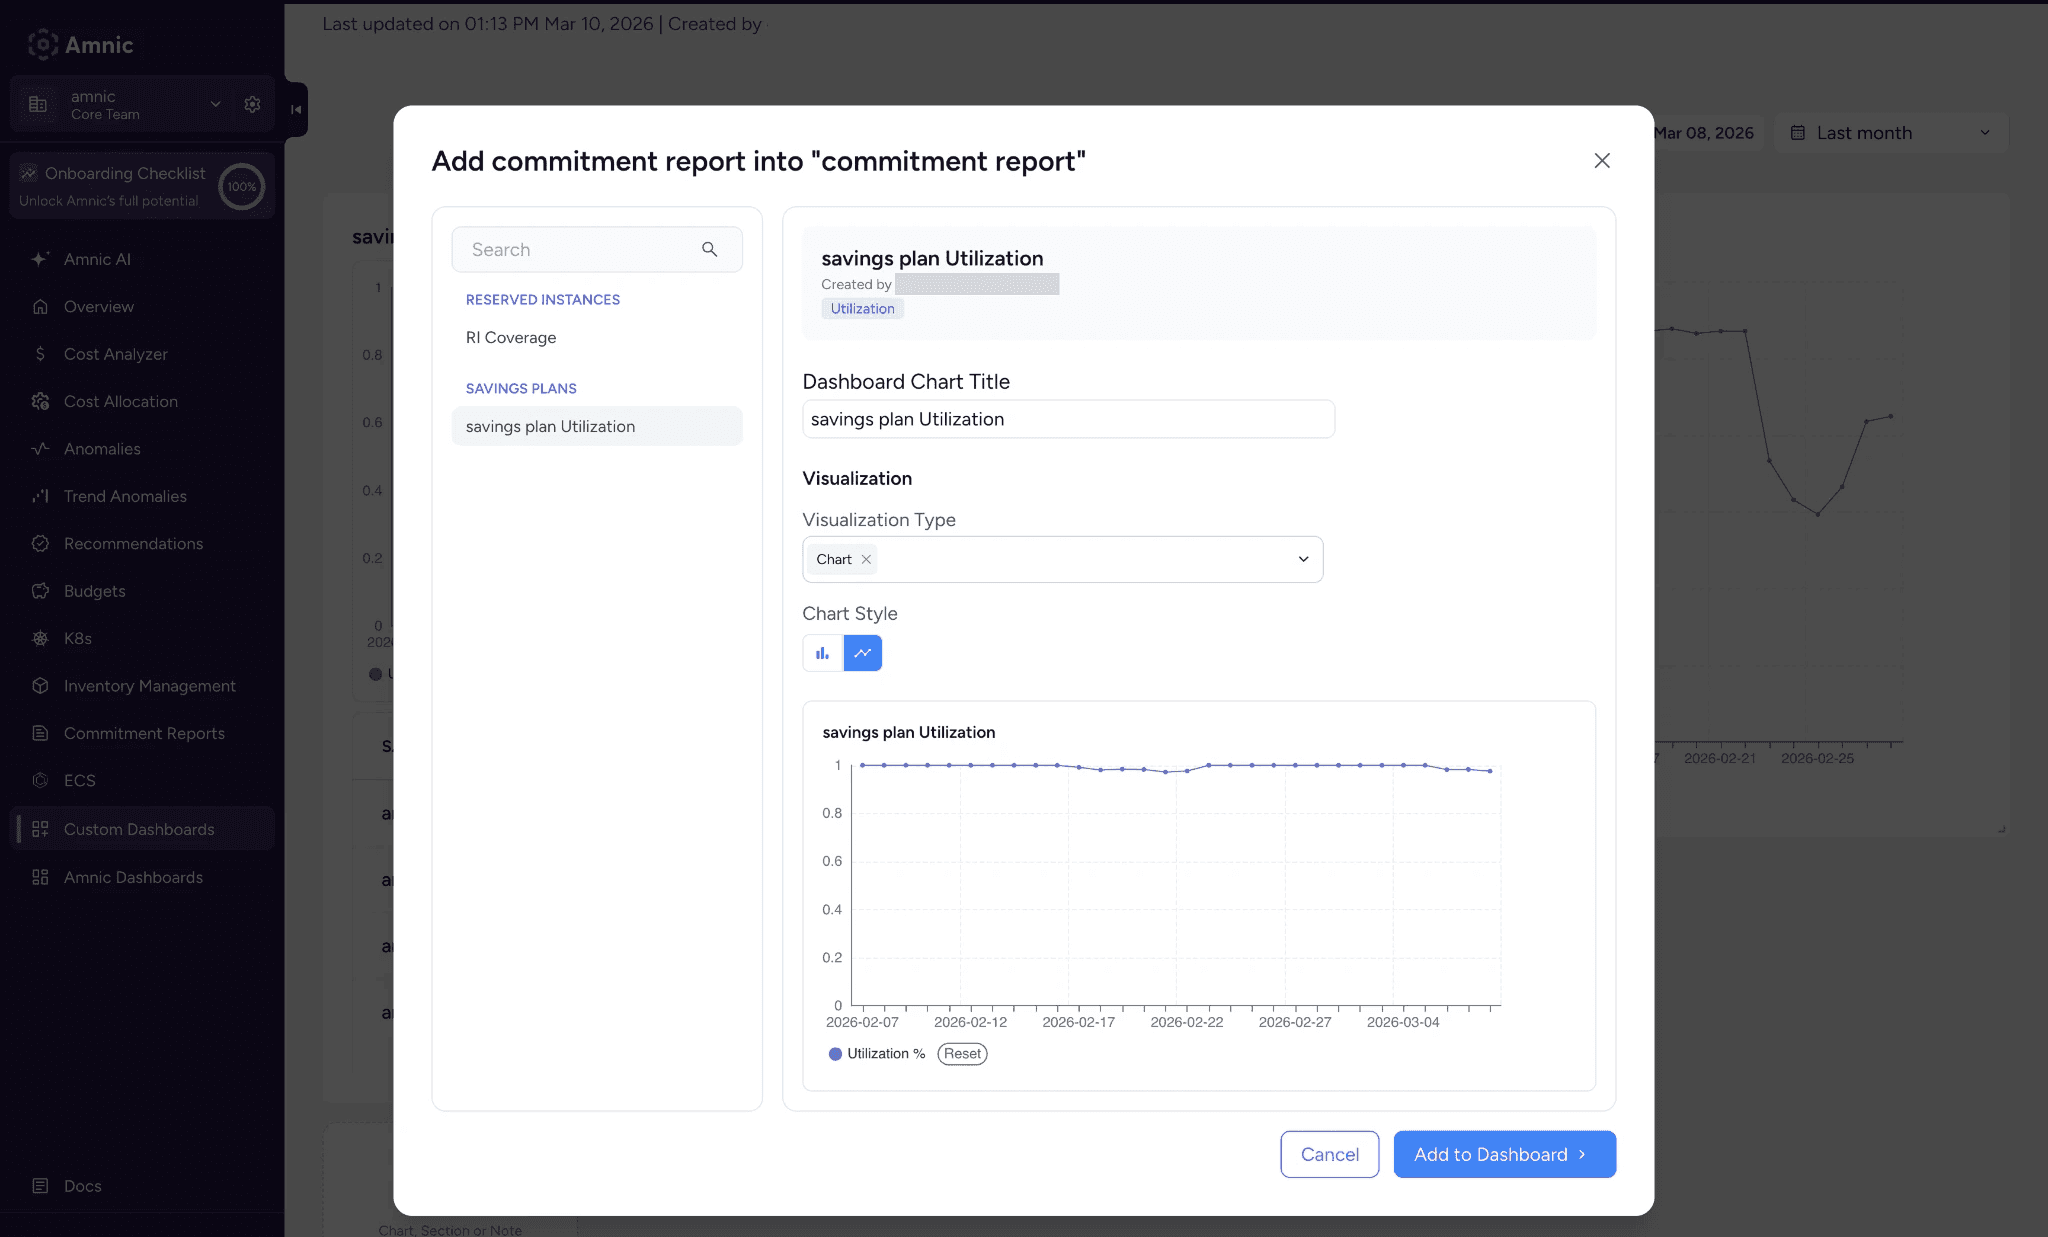
Found a chart worth keeping an eye on? Save it straight to your Custom Dashboard and keep your most important commitment metrics front and center.
Ready to see what your commitments are actually doing? Head over to Commitment Reports and start exploring.


