February 2, 2023
Prometheus and Grafana: Observability stack in K8s
10 min read

Embracing microservices has revolutionalized software development, but monitoring a large number of metrics is a challenge. This blog explores using Prometheus and Grafana to monitor a Kubernetes cluster, using a simple Nginx server as an example.
Introduction
Over the past decade, several organizations have embraced microservices architecture, and this has been due to numerous benefits such as ease of operation, improved performance and enhanced scalability of applications. Companies are now relying on distributed microservices to provide a better experience for their end users. However, such a shift has raised some challenges around effectively monitoring the operation of such a distributed infrastructure.
Monitoring is an important factor for operating a microservices architecture efficiently. It is easy to adapt resources according to the user’s needs when working with a monolith. However, in a scenario where thousands of microservices are involved, it is difficult to observe the state of each microservice and adapt it according to the users’ needs and demands. Therefore, we need to proactively detect problems and failures and optimize the provisioning of resources, like CPU and memory, as per the requirement. In this context, Kubernetes offers monitoring features for cluster administrators to get a holistic view of the cluster, providing information about each deployed resource. Among several observability stack, one widely used stack is Prometheus and Grafana.

Prometheus is an open-source systems monitoring and alerting toolkit originally built at SoundCloud. The tool collects and stores its metrics as time series data (metrics information is stored with the timestamp at which it was recorded) alongside optional key-value pairs called labels.

Grafana allows you to query, visualize, alert on and understand your metrics no matter where they are stored. The tool lets you create, explore, and share beautiful dashboards with your team and helps you foster a data driven culture.
In this blog, we will discuss how to setup Prometheus and Grafana in order to monitor a Kubernetes cluster. For illustration purposes, we will deploy a simple Nginx server and monitor it.
Prerequisites
To complete this walkthrough:Get access to a Kubernetes environment. We are using a local environment powered by minikube. Install kubectl command line application and configure it to interact with the cluster.Install Helm charts on local machine to install Prometheus and Grafana.
First, we create a deployment object that manages the Nginx server.
Once the server is deployed, we need to expose it using Kubernetes services.
As we are running the Kubernetes cluster locally, so we have to do port forward to visualise the deployed Nginx in a local browser using the below command:
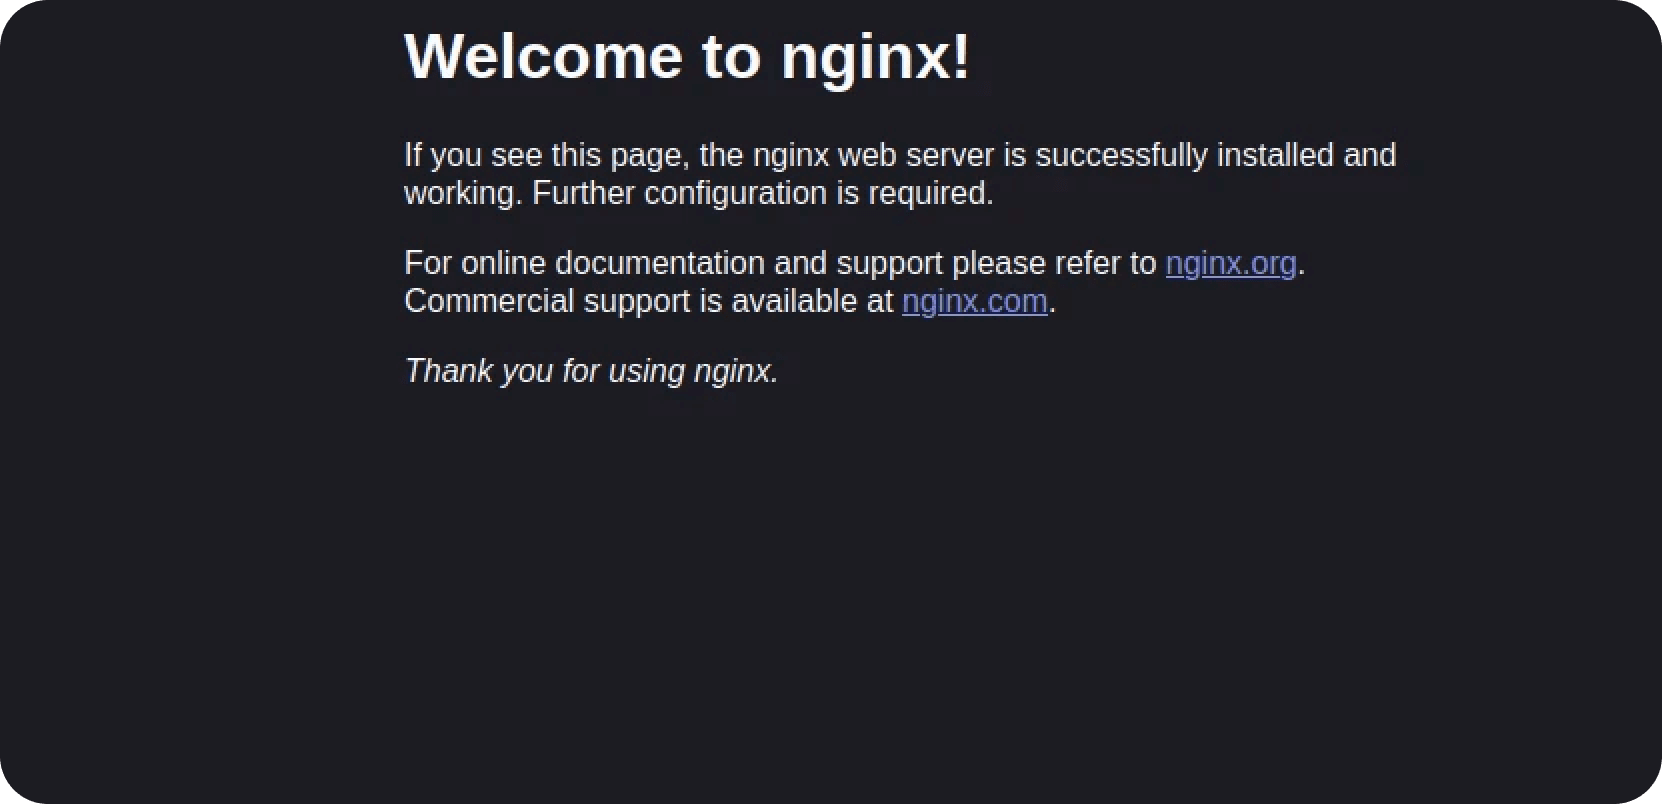
Now, as the service is exposed, we can reach it using the localhost and the port that is now exposed – http://localhost:8080
SET UP
Setting up Prometheus
The continuous monitoring of the deployed microservices infrastructure is important to deliver the best quality services. In the next step, we will set up the monitoring stack of Prometheus and Grafana using the Helm charts tool, which is a package manager for Kubernetes applications. First, we would need to create a namespace Prometheus and add the Prometheus helm chart repository.
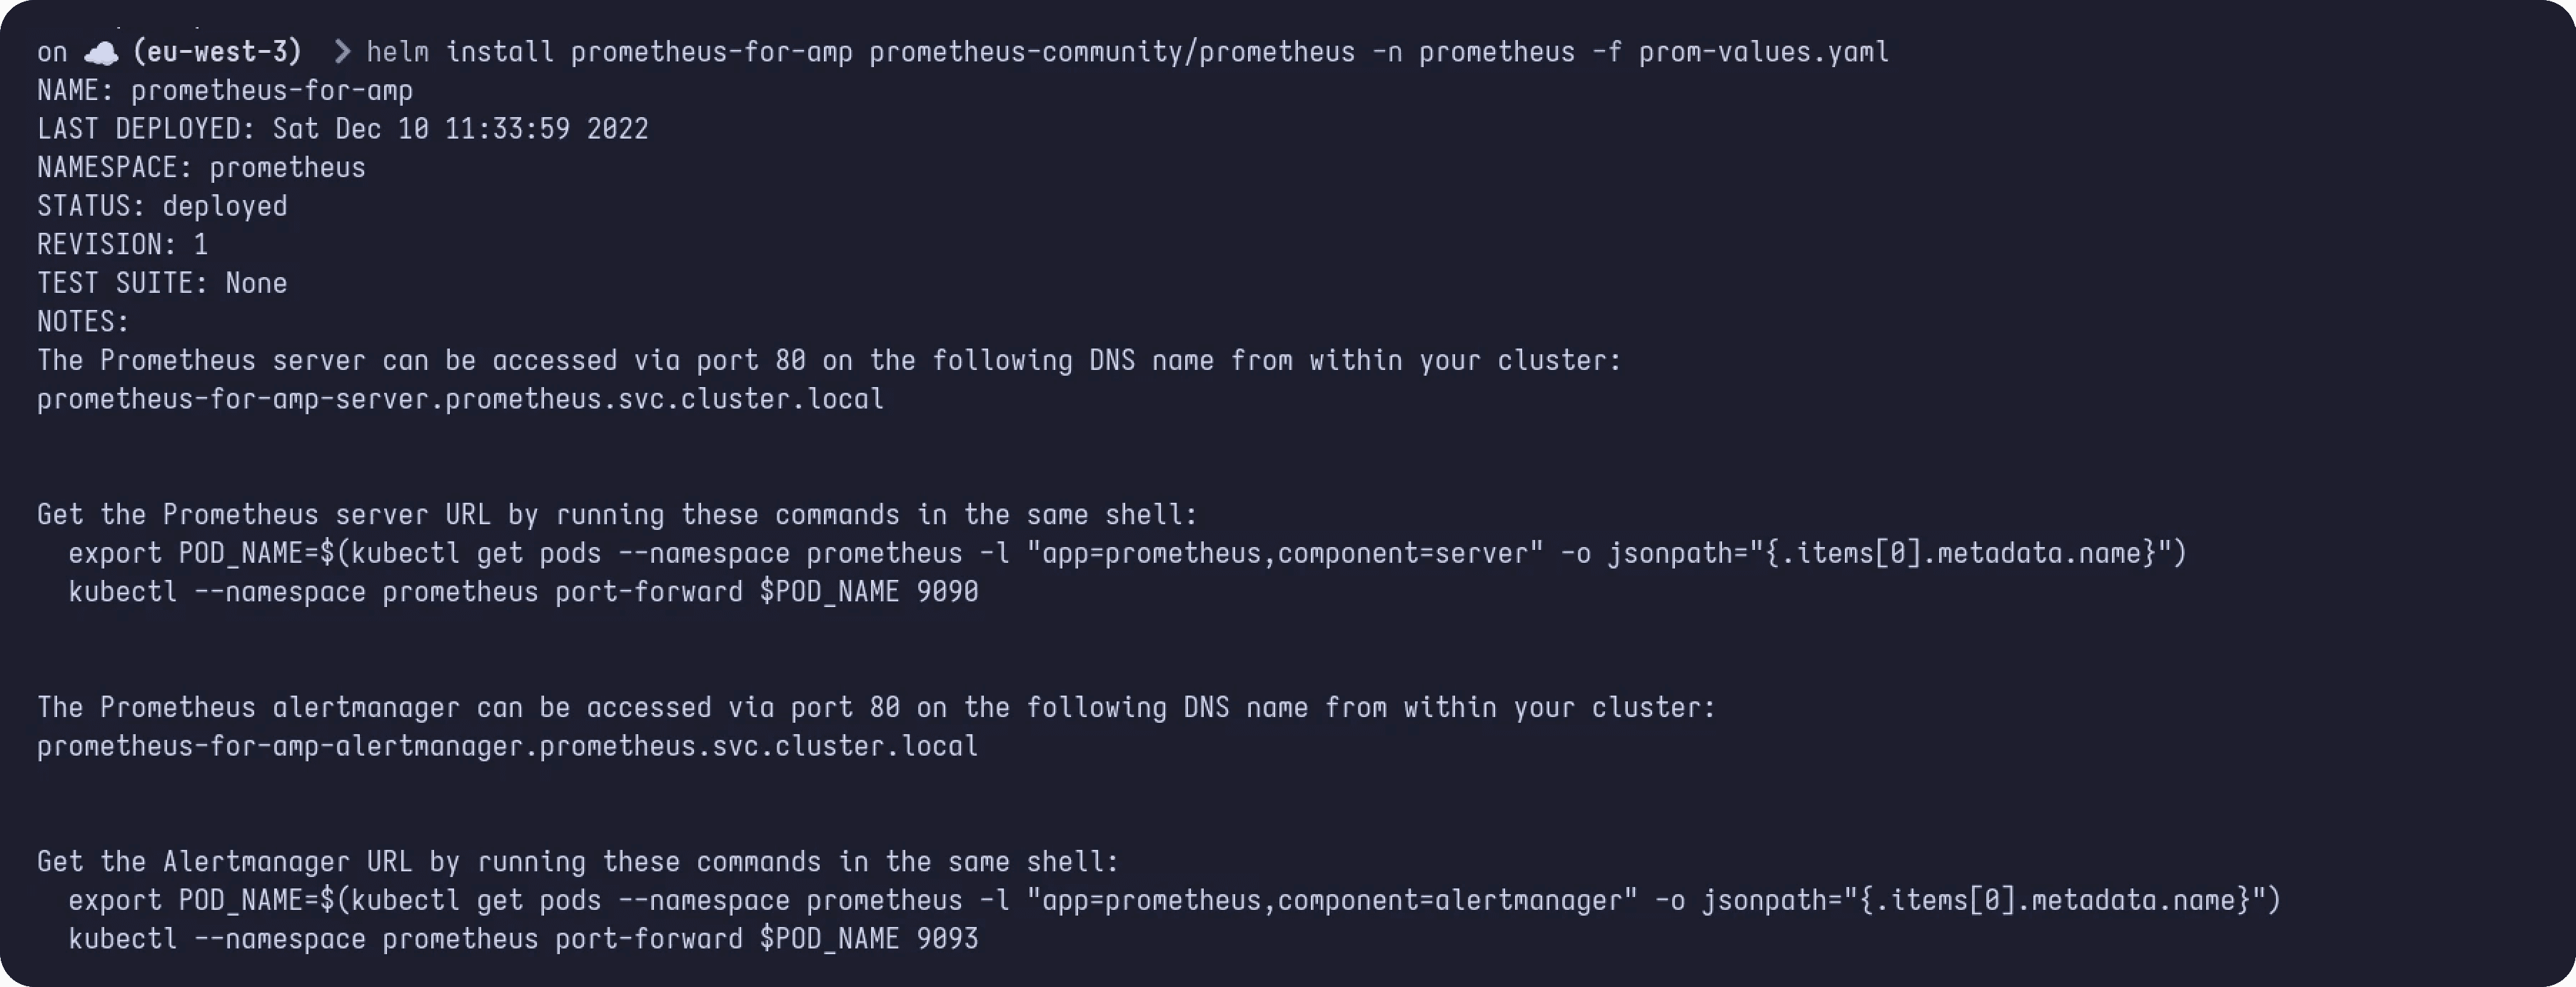
Next, we will install the Prometheus server in the namespace created previously:
The Prometheus server is successfully installed.
We will do a port forward to fetch the Prometheus UI in local browser using the below command:
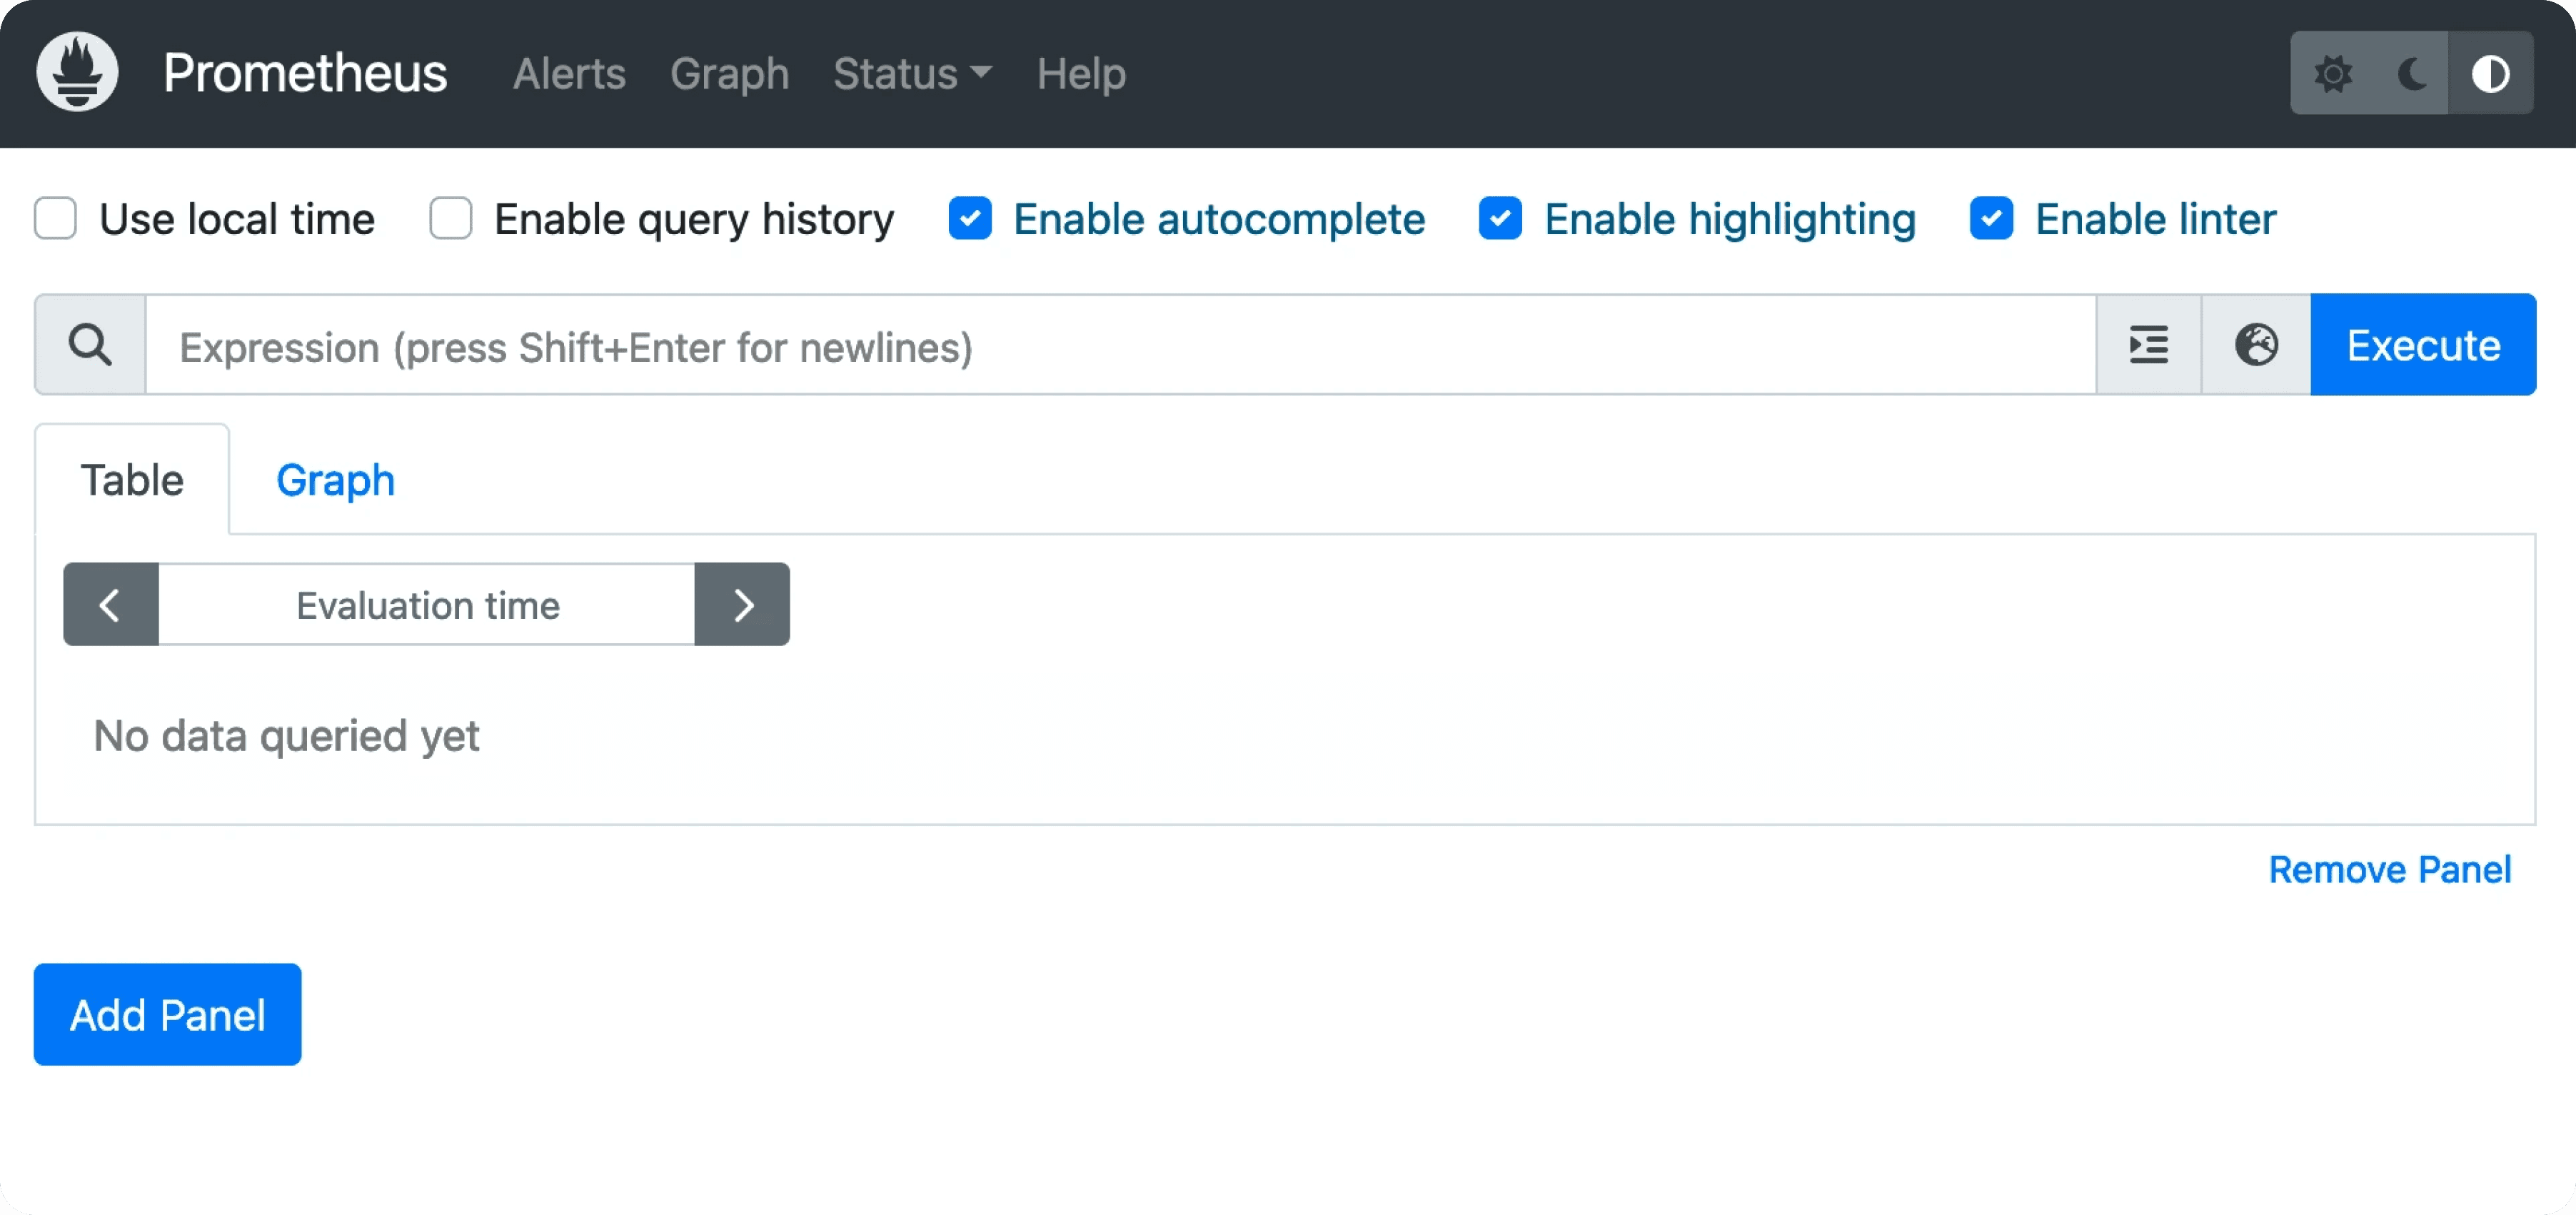
Let’s access Prometheus UI in local browser with the URL – http://localhost:9090/
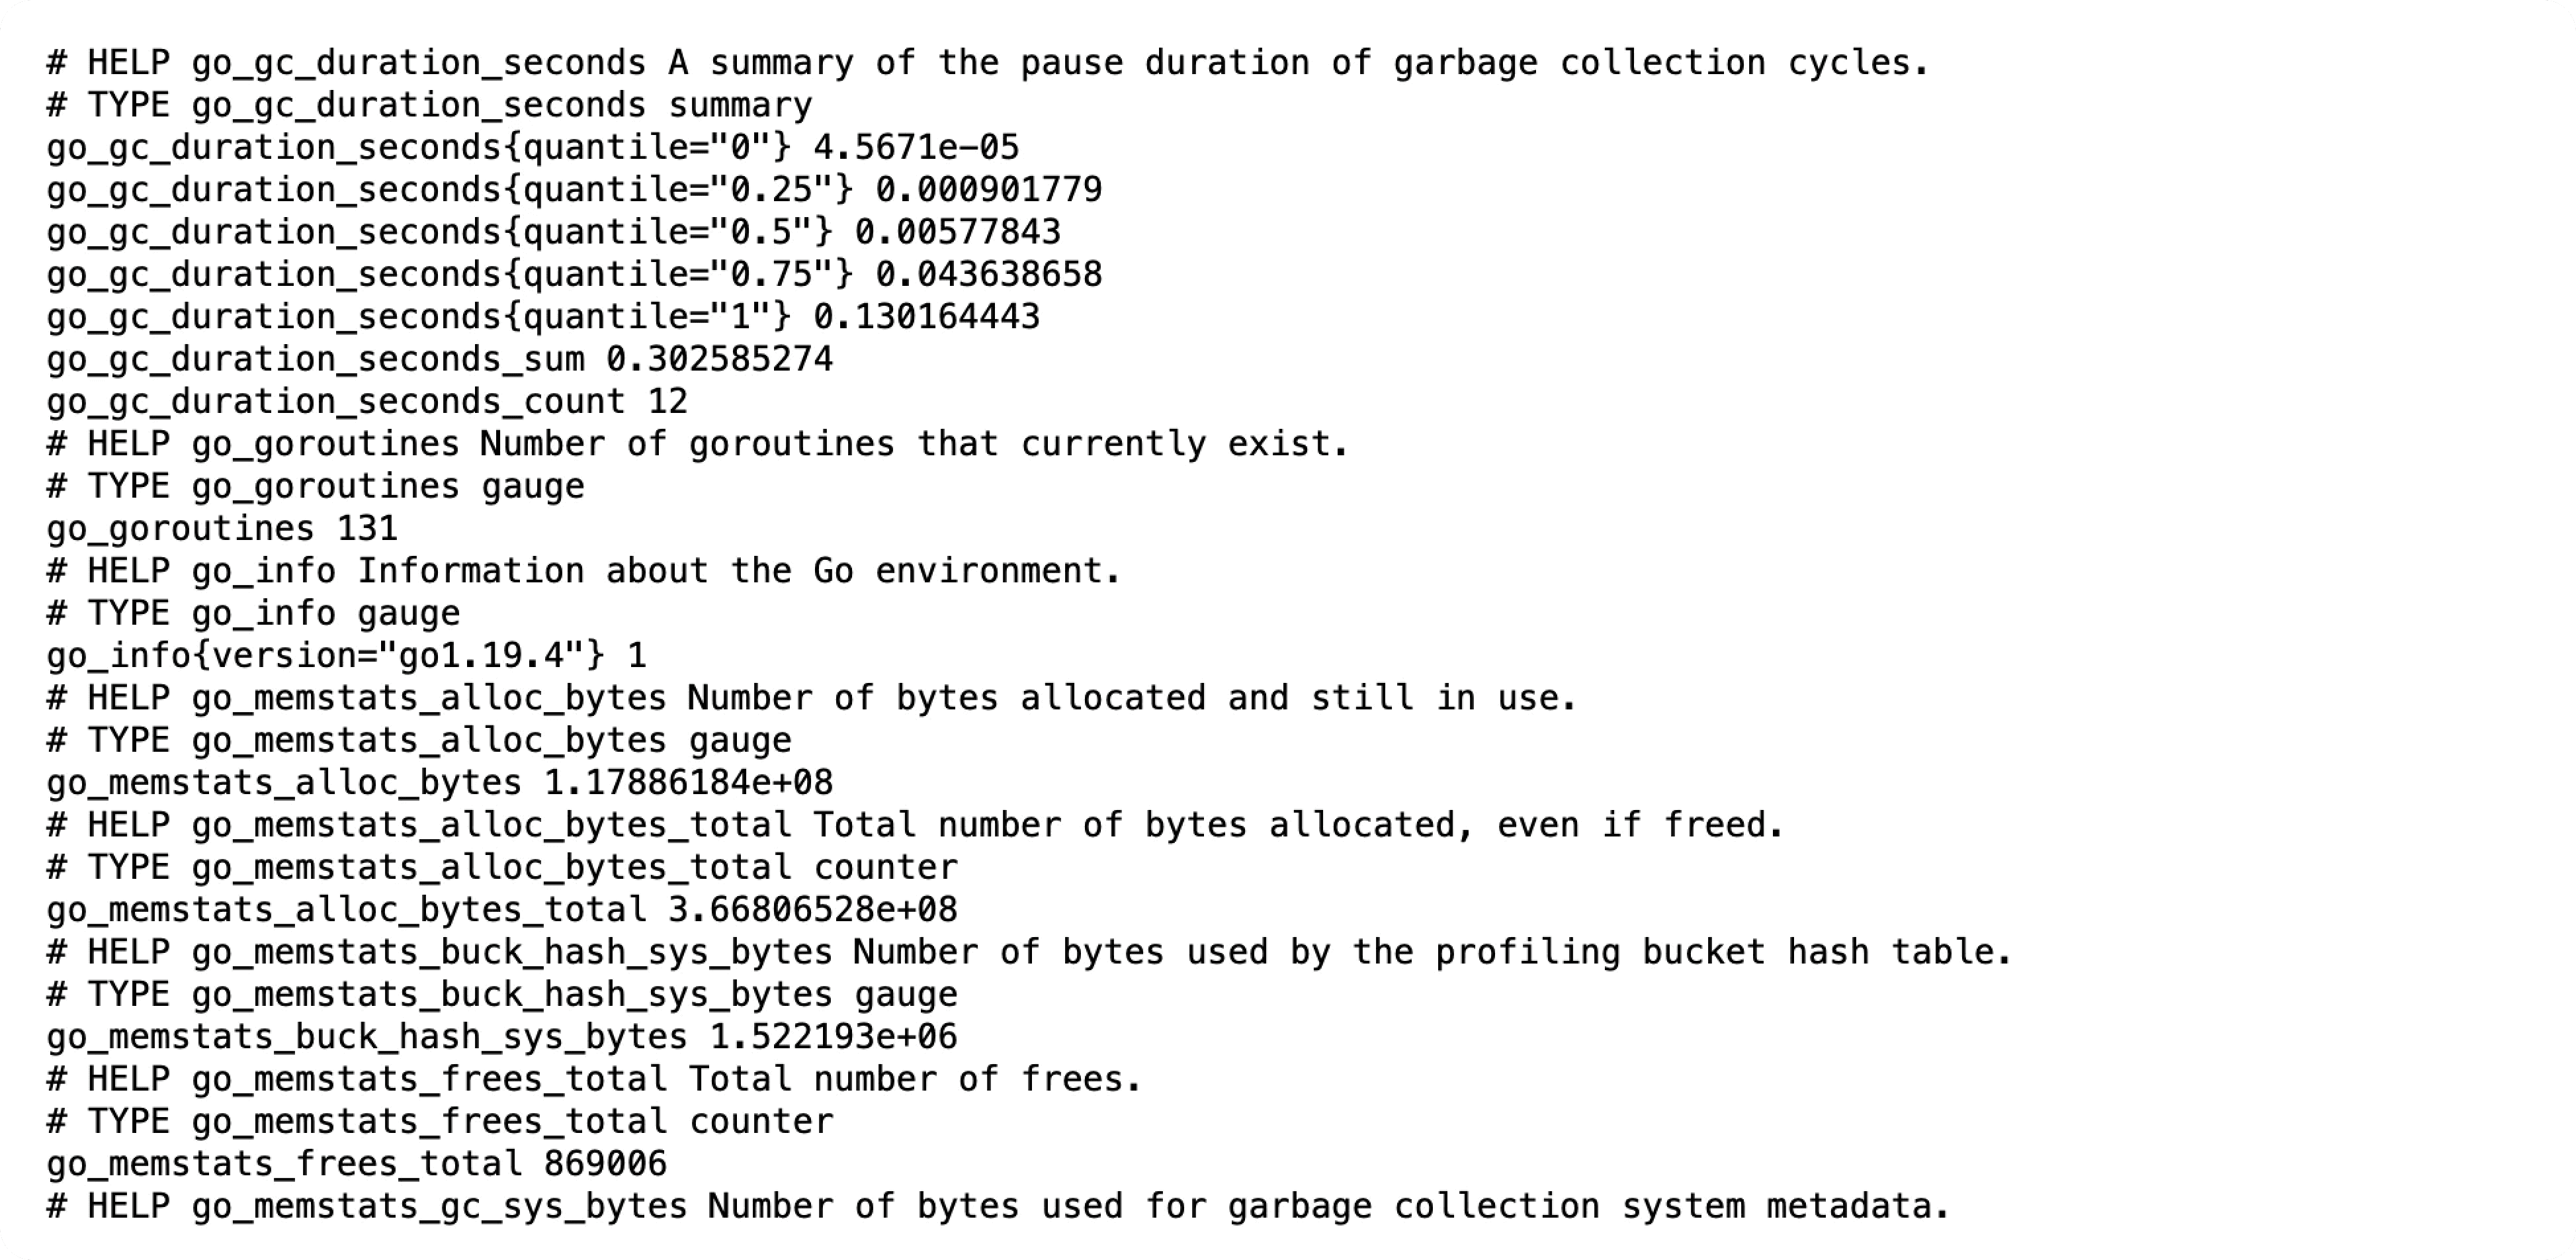
To view all the metrics in Prometheus, we will use /metrics path with Prometheus URL – http://localhost:9090/metrics
Setting up Grafana
To visualize the metrics collected from Prometheus, we will install Grafana in the cluster.
We will create a grafana.yaml that will contain the configuration parameters of Grafana and allow reading metrics from the Prometheus server deployed on the cluster. The following is a simple configuration file that declares Prometheus as a data source for Grafana.
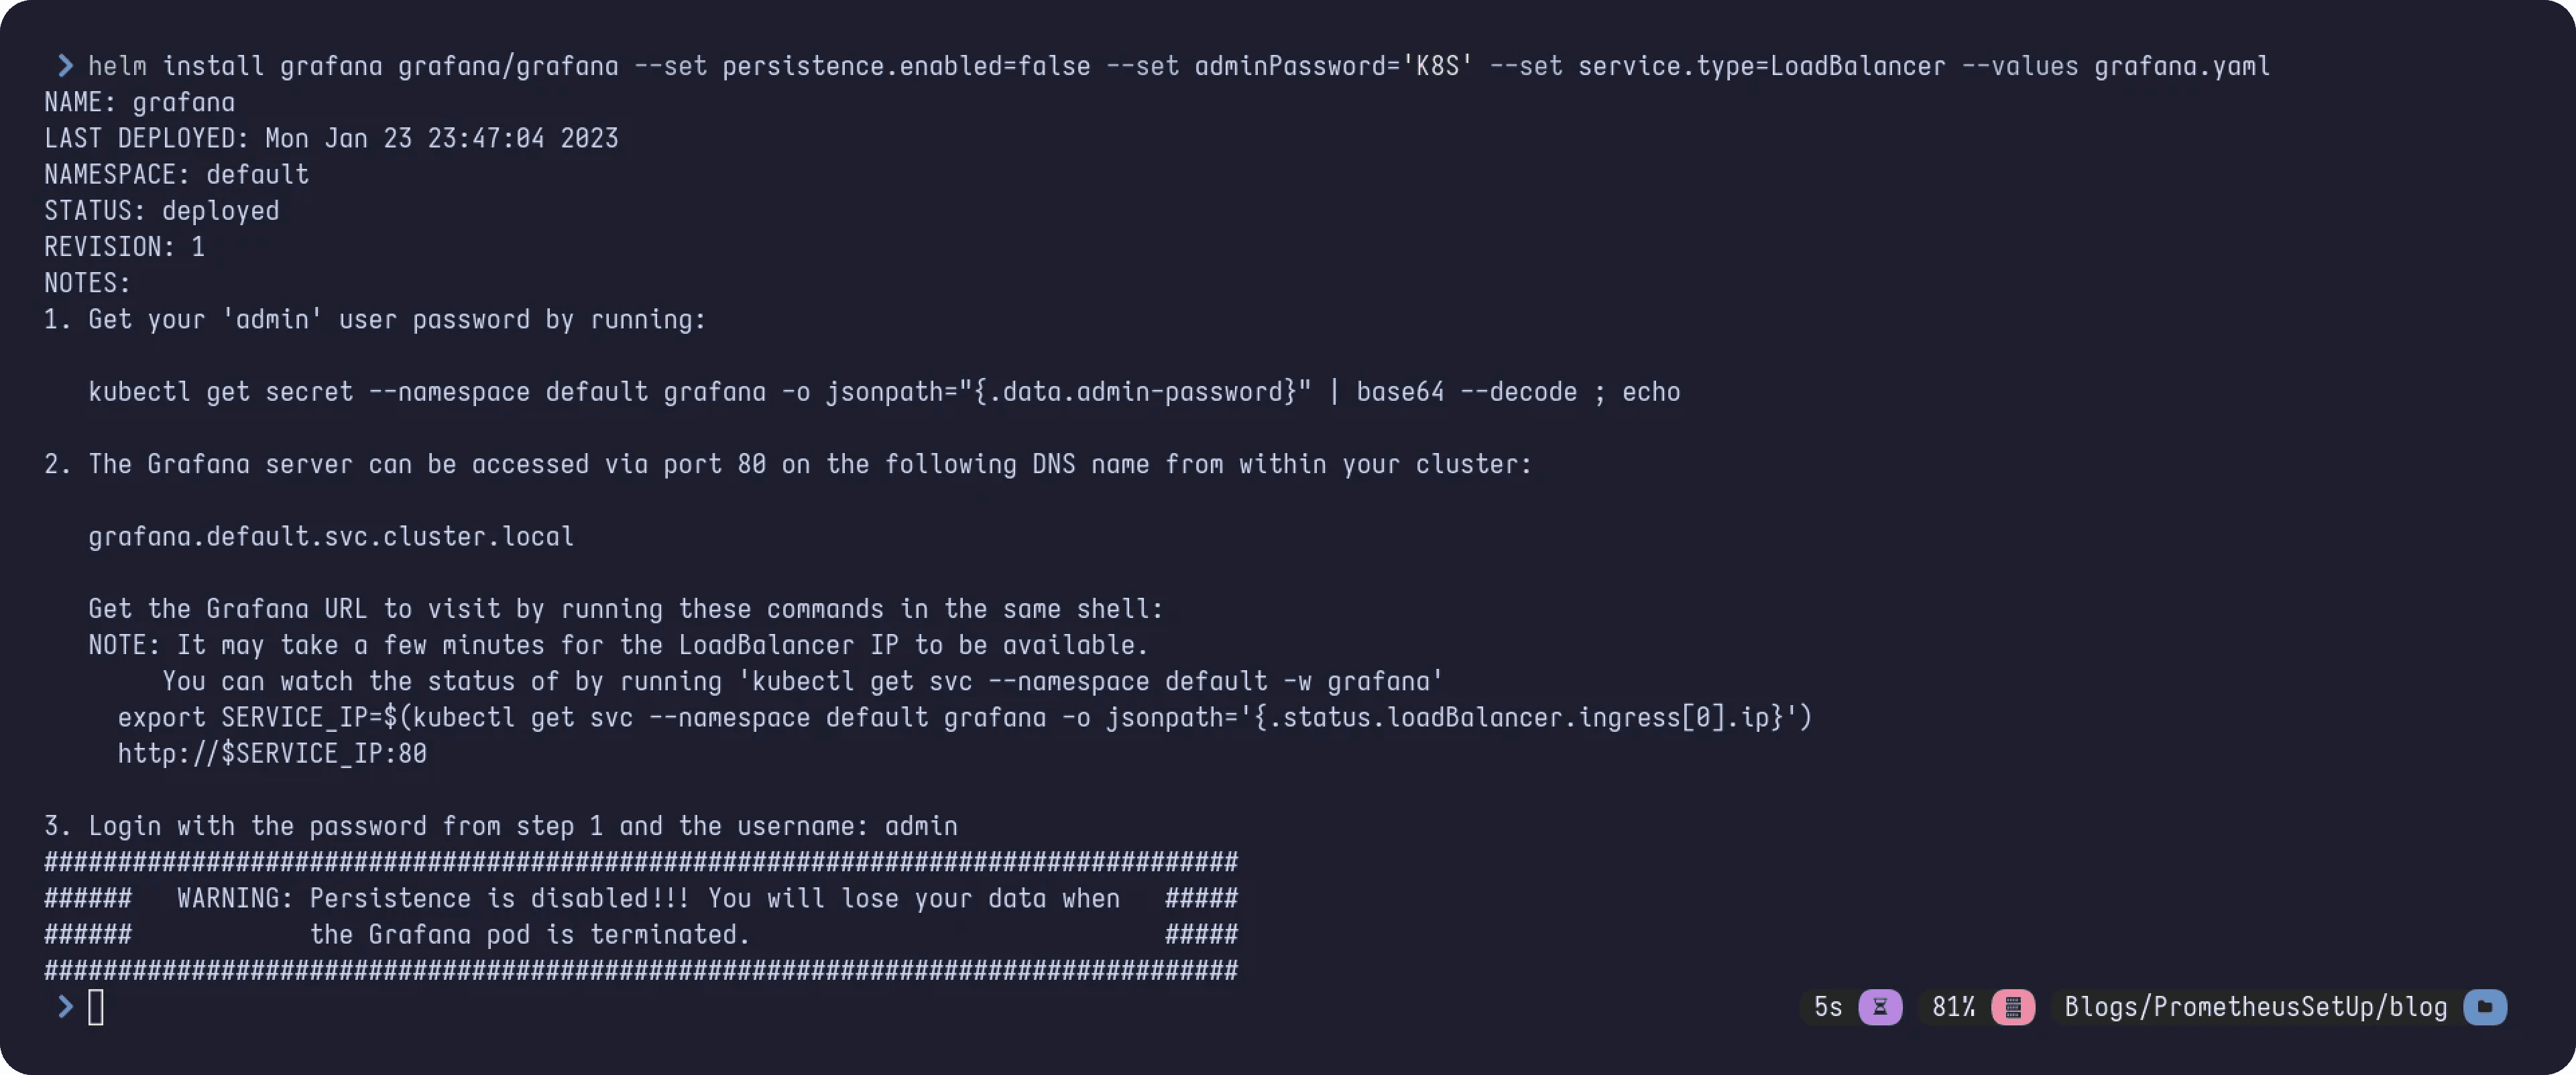
Next, we will use Helm charts to install Grafana, note that we specified K8S as the admin password.
The Grafana server is successfully installed.
To access the Grafana dashboard, we will do port forward using the below command:
Now we can access Grafana in our browser using the URL – http://localhost:3000/
The credentials to log in to Grafana is below unless changed:
Username: admin
Password: K8S
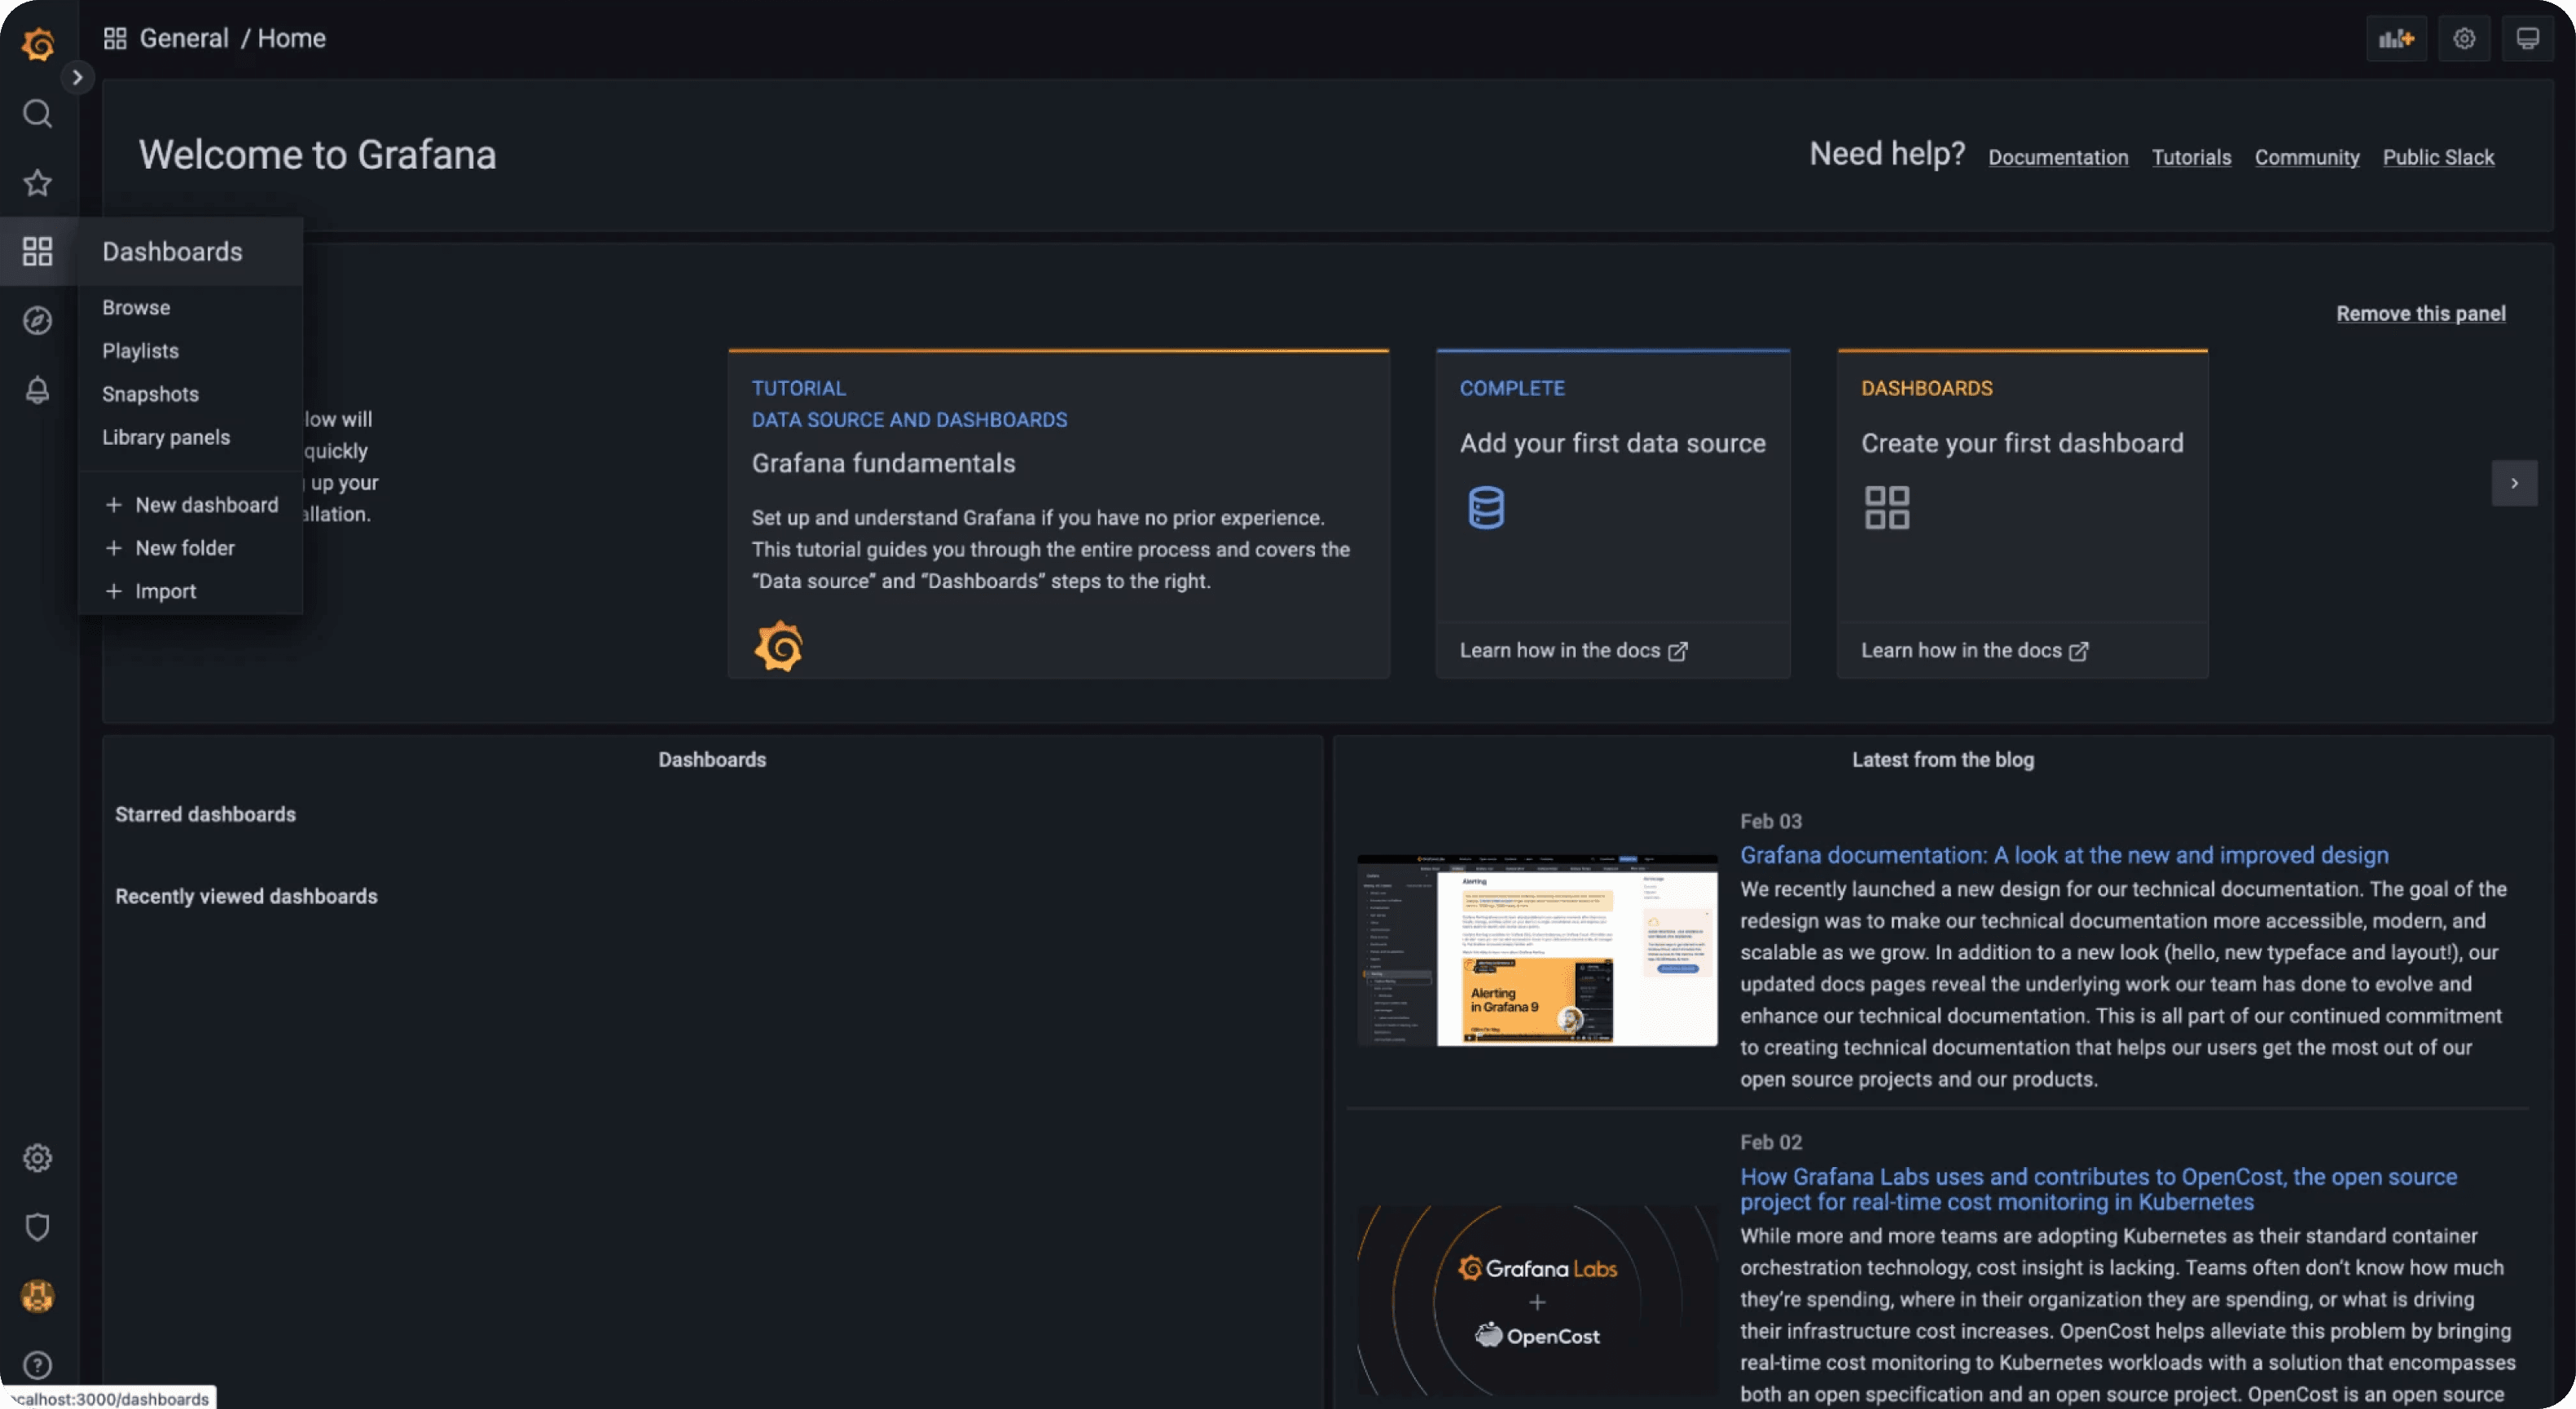
After logging in, we will add an already available dashboard in Grafana with ID 3119 that gives the Kubernetes overview. By accessing the below URL, you can view examples of pre-built Grafana dashboards. https://grafana.com/grafana/dashboards/
Select Import from the drop-down menu.
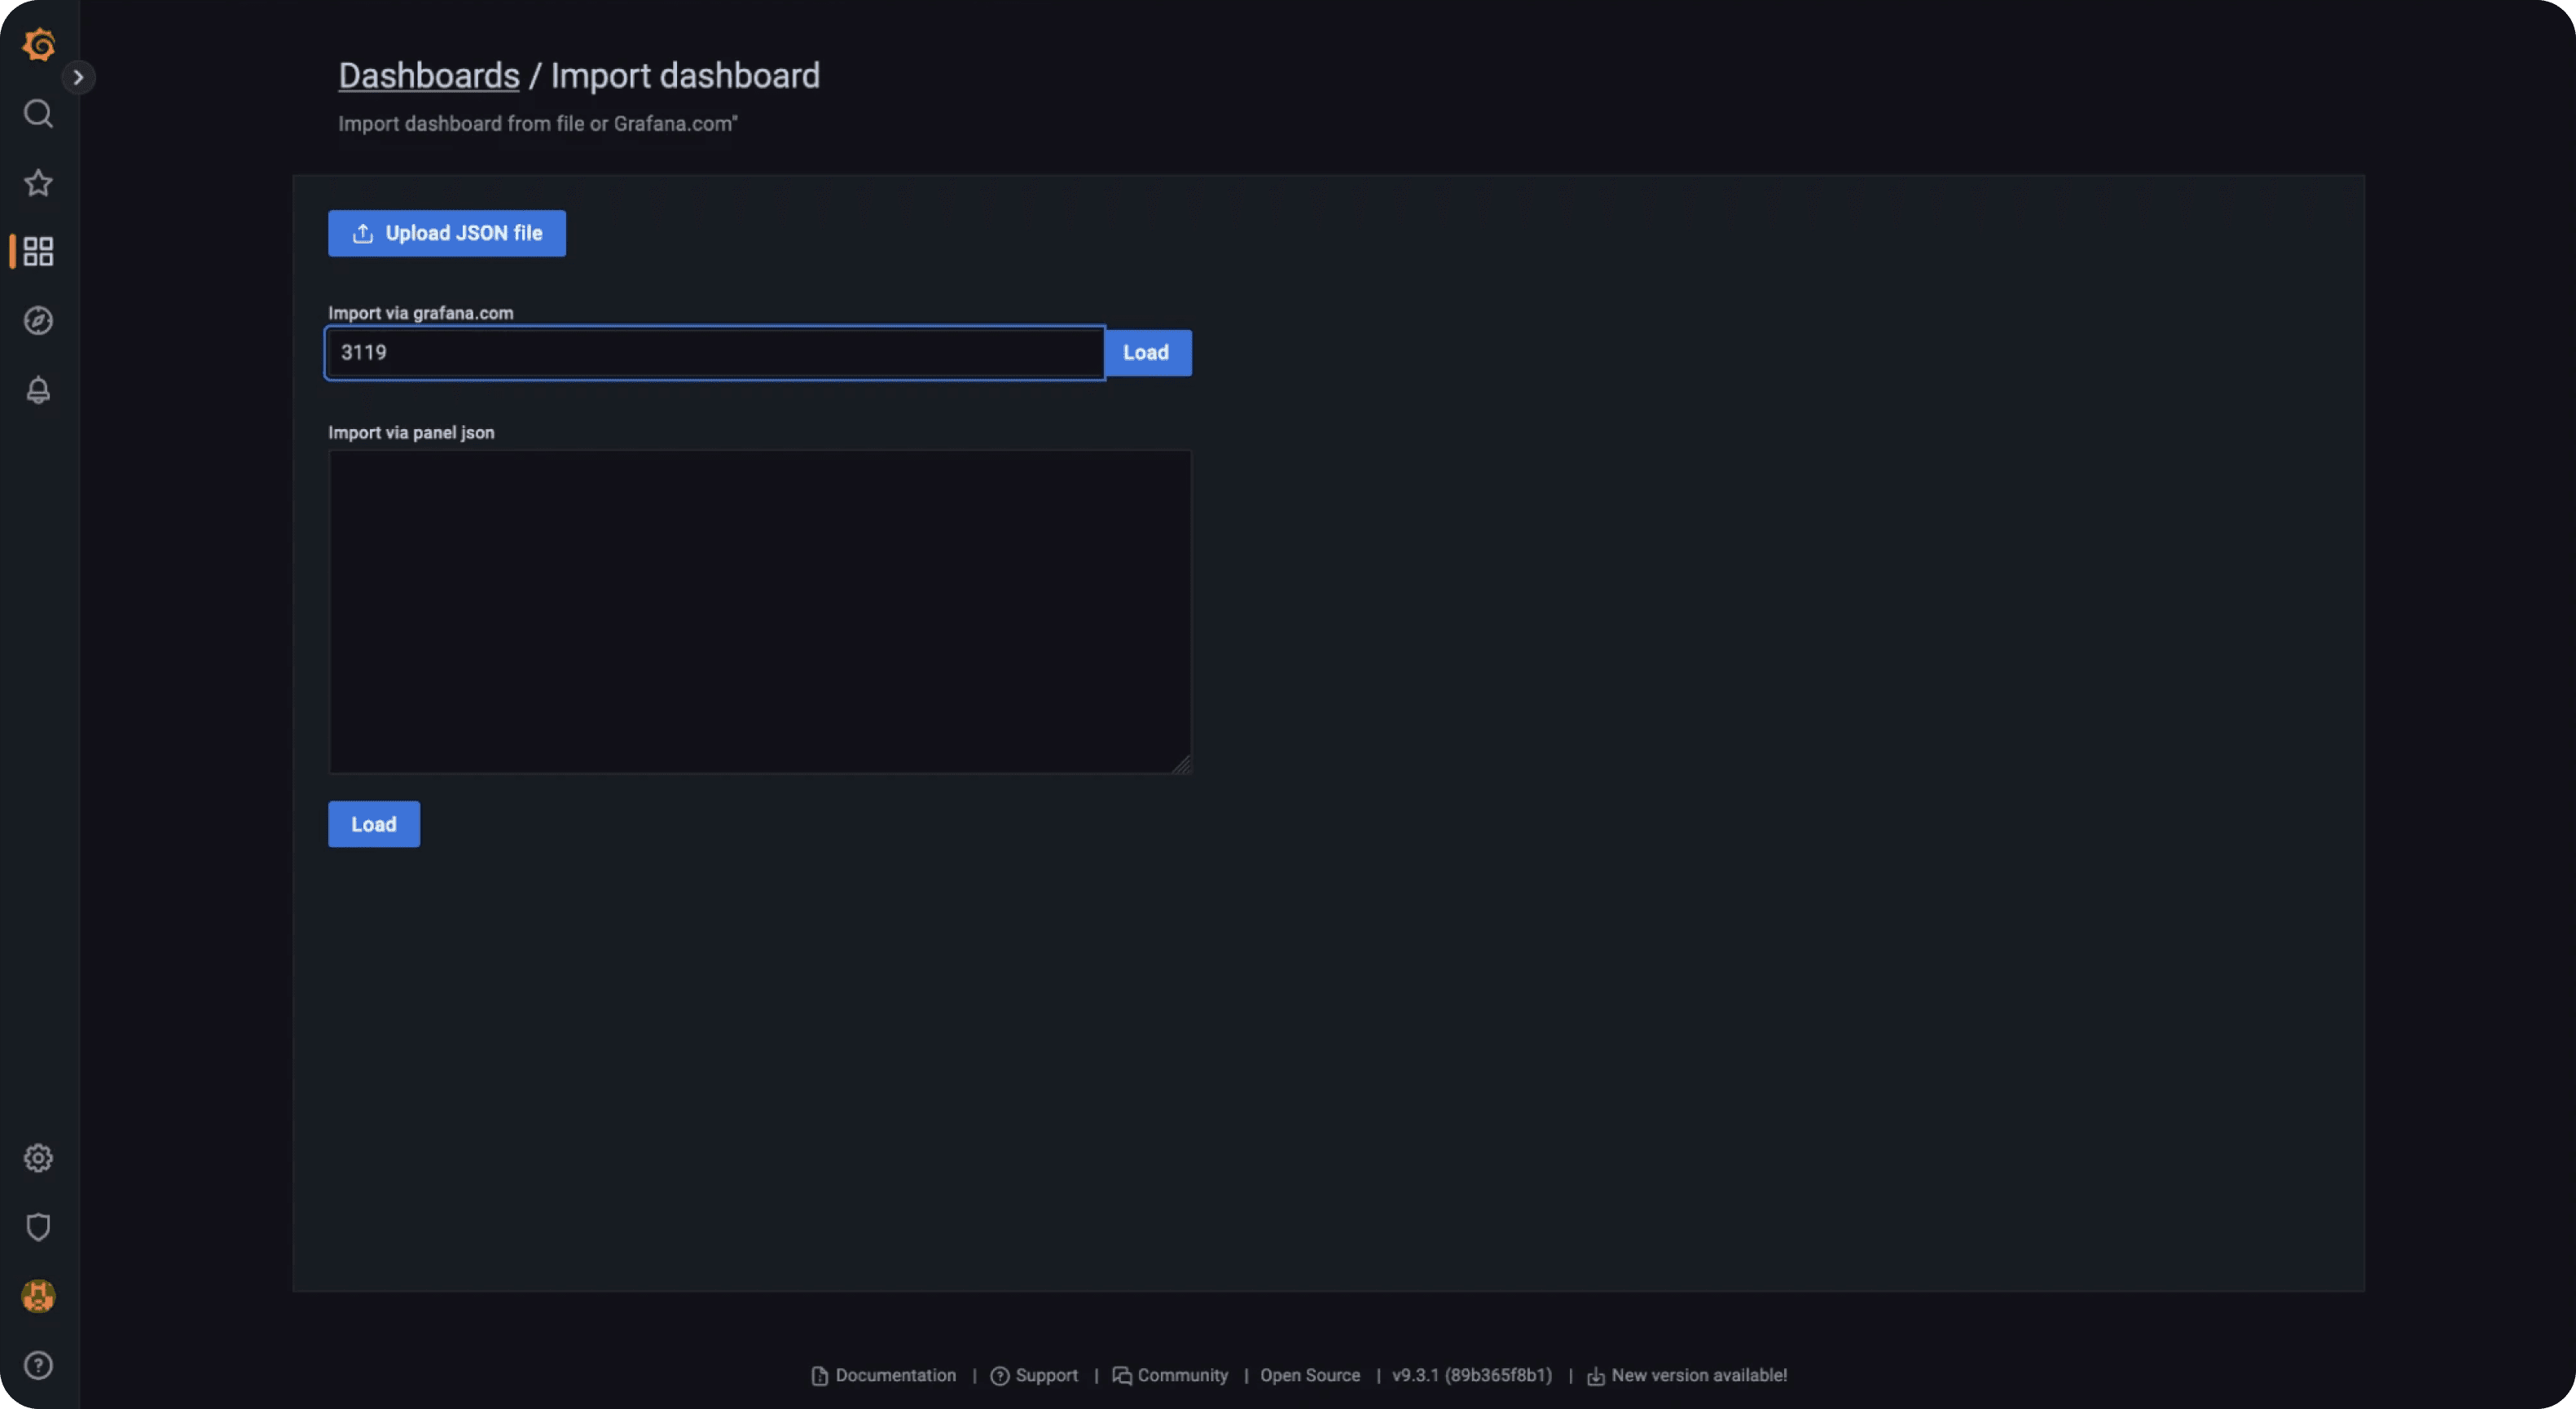
Enter the dashboard ID as 3119 and click the Load button.
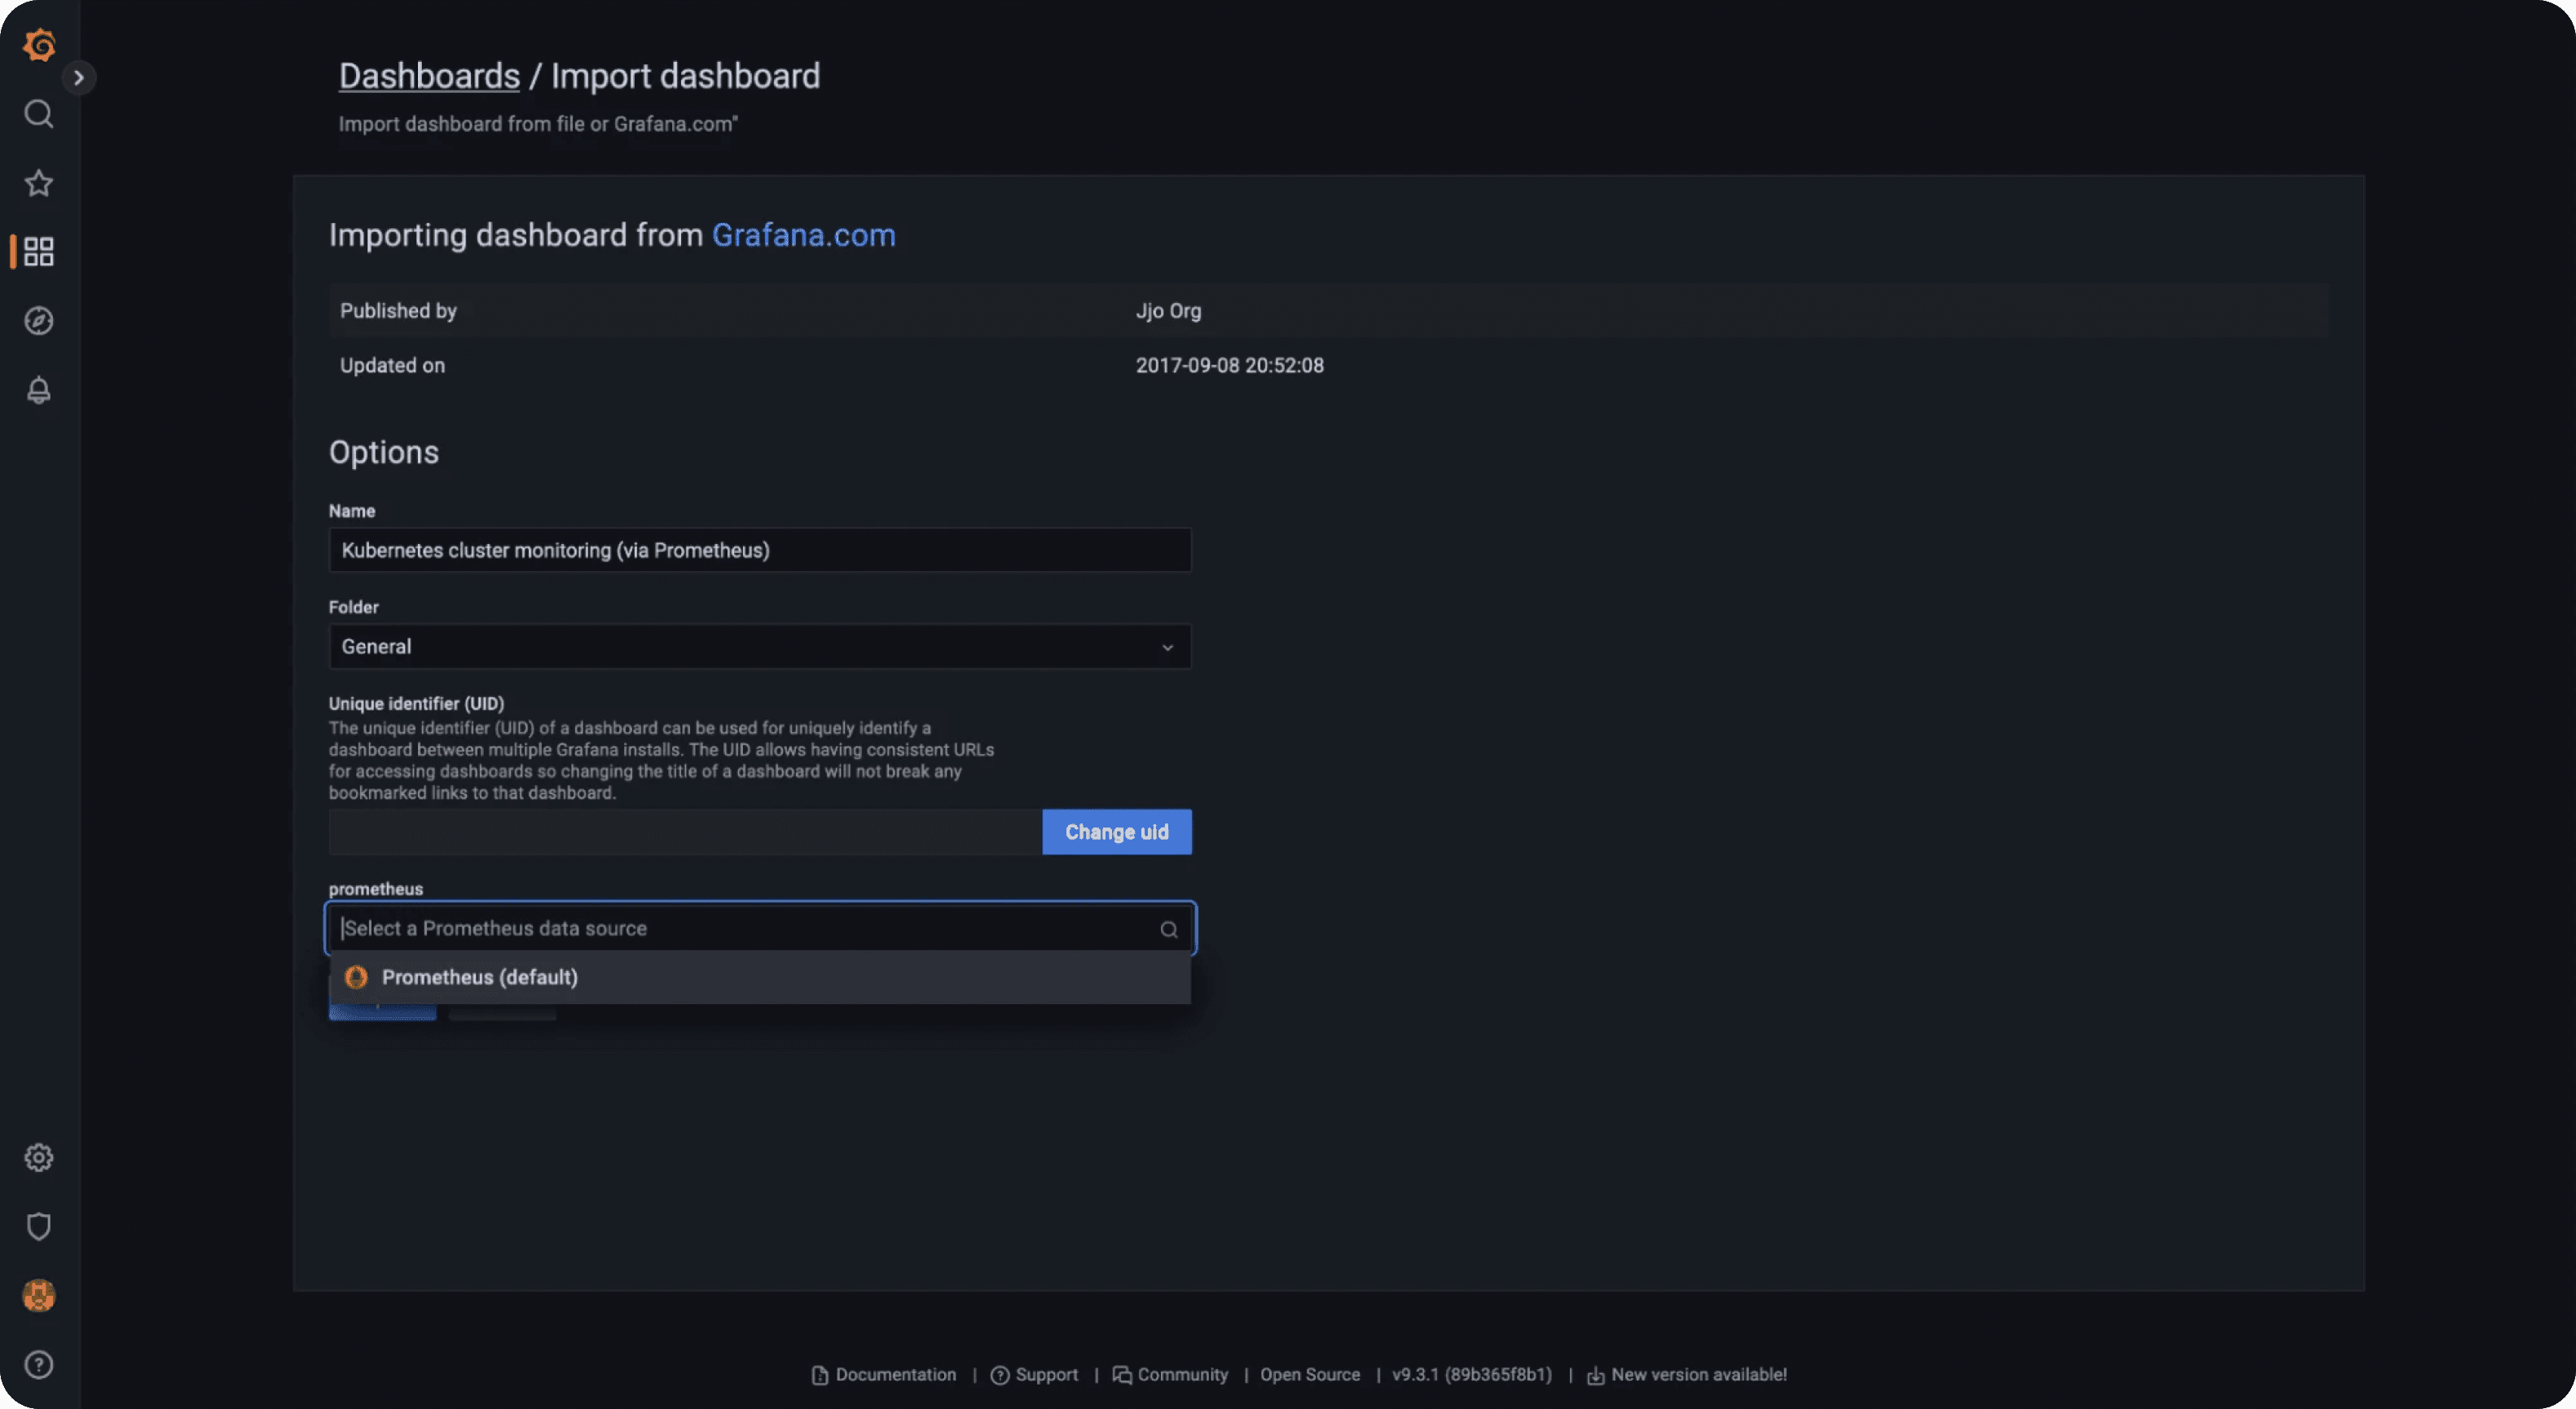
Next, we add the data source for this dashboard, i.e., Prometheus and after that, we can click on Import:
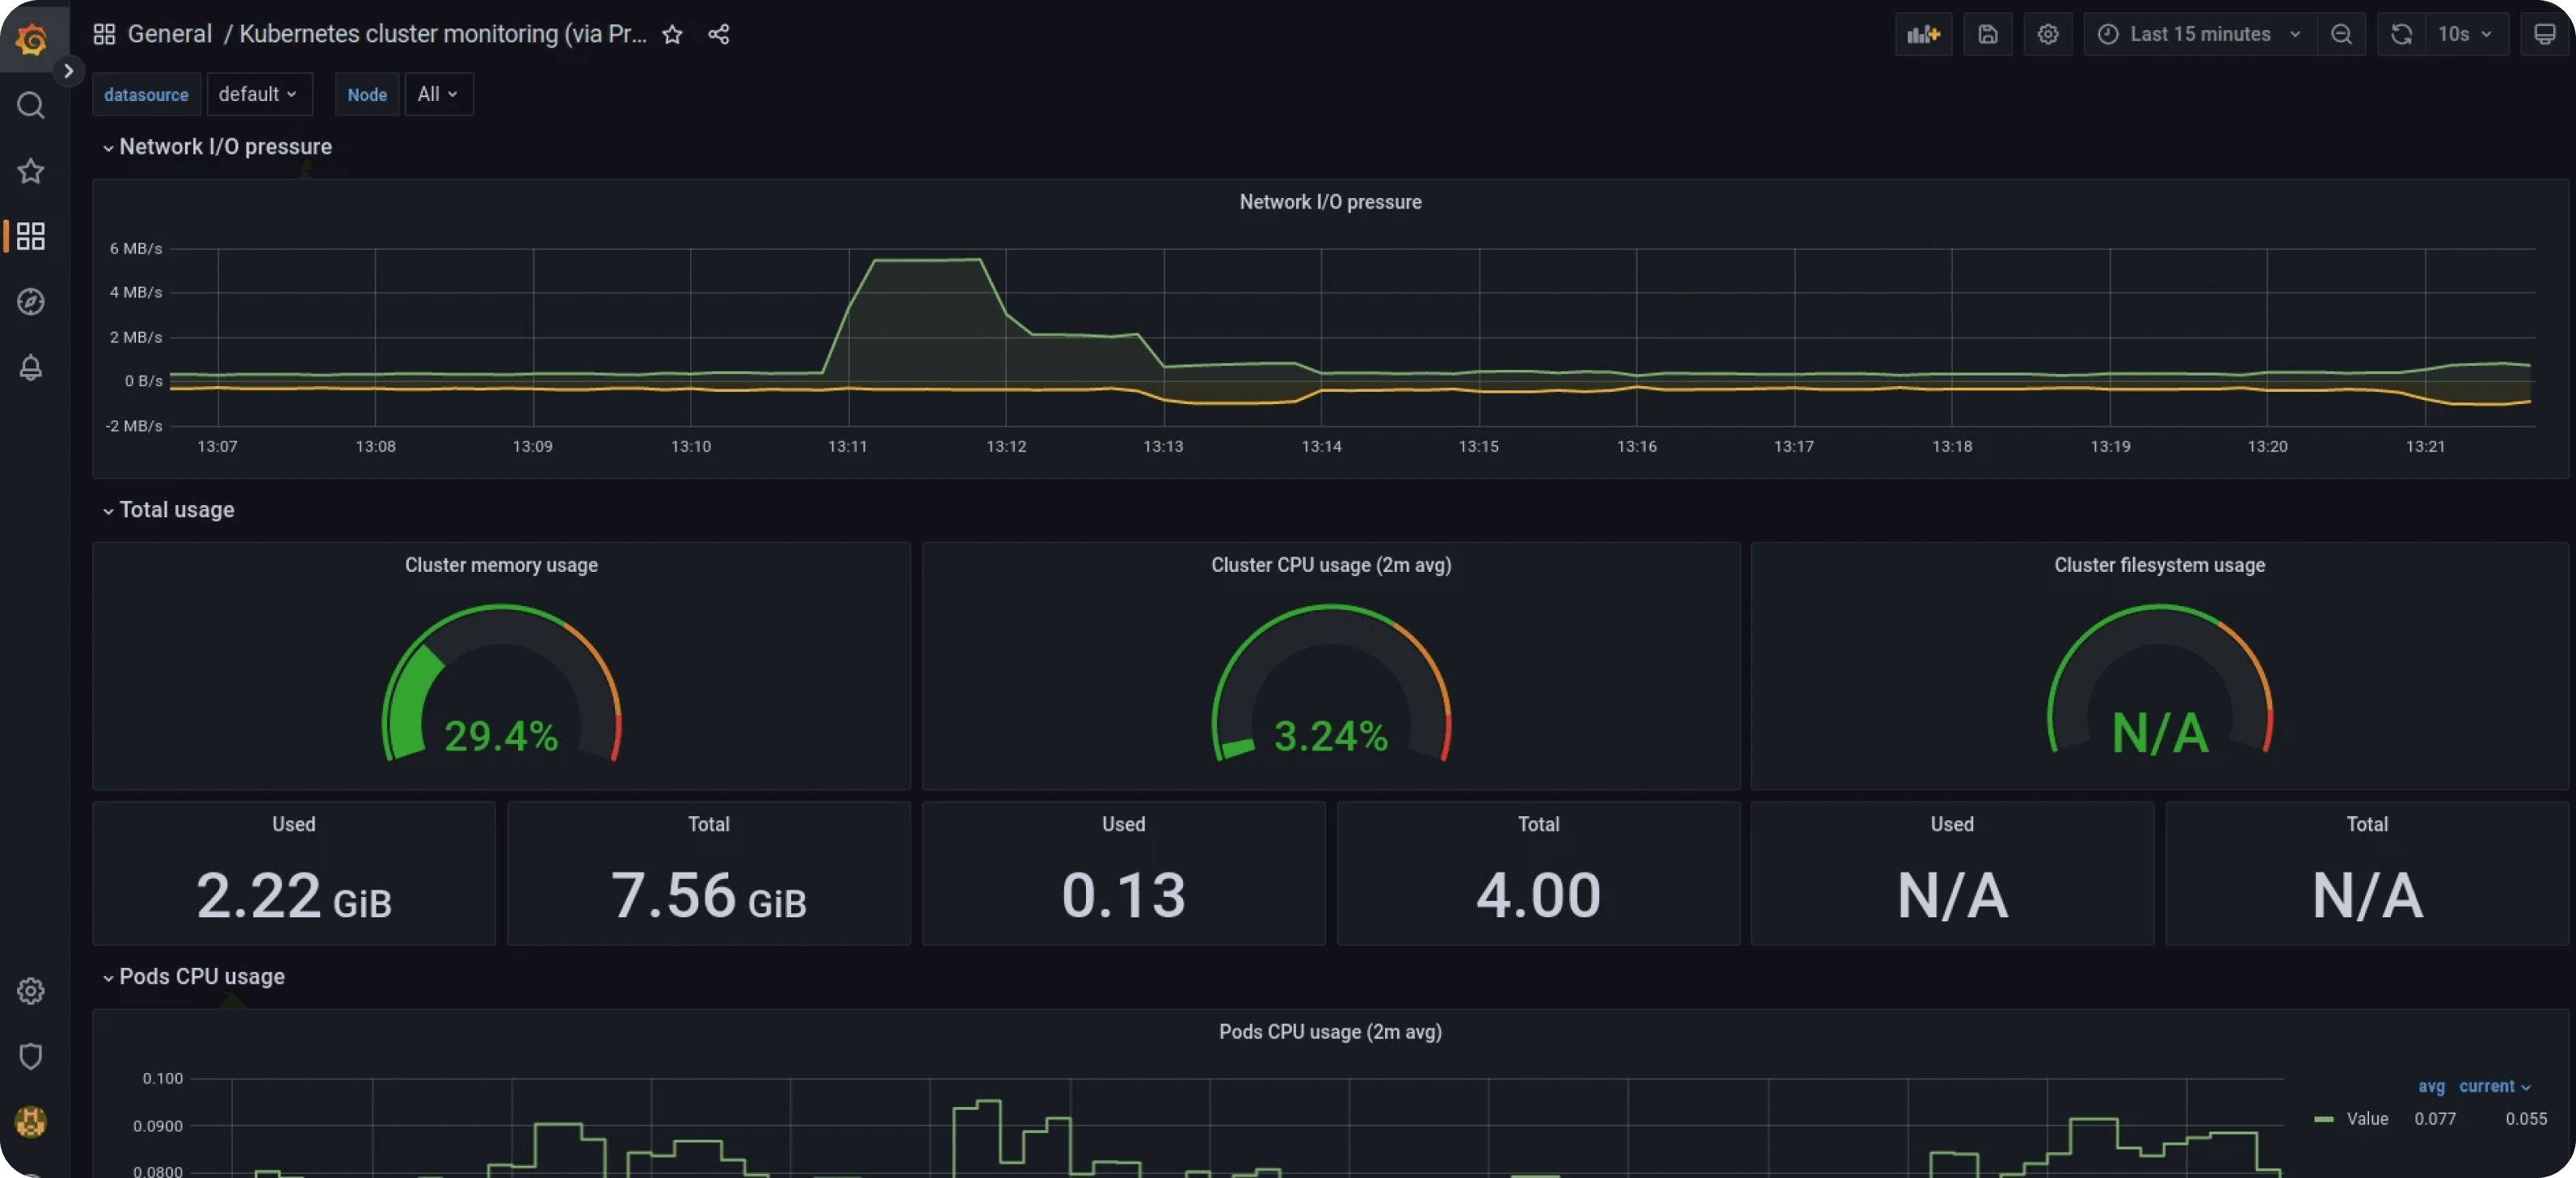
After the dashboard is imported, the visualisation of Kubernetes cluster overview will appear as below:
Conclusion
In this blog, we covered how to create a monitoring stack based on open source tools such as Prometheus and Grafana to continuously observe your cluster resources and apply the needed actions to provide the best experience for the end users.
